Fig. A.1.
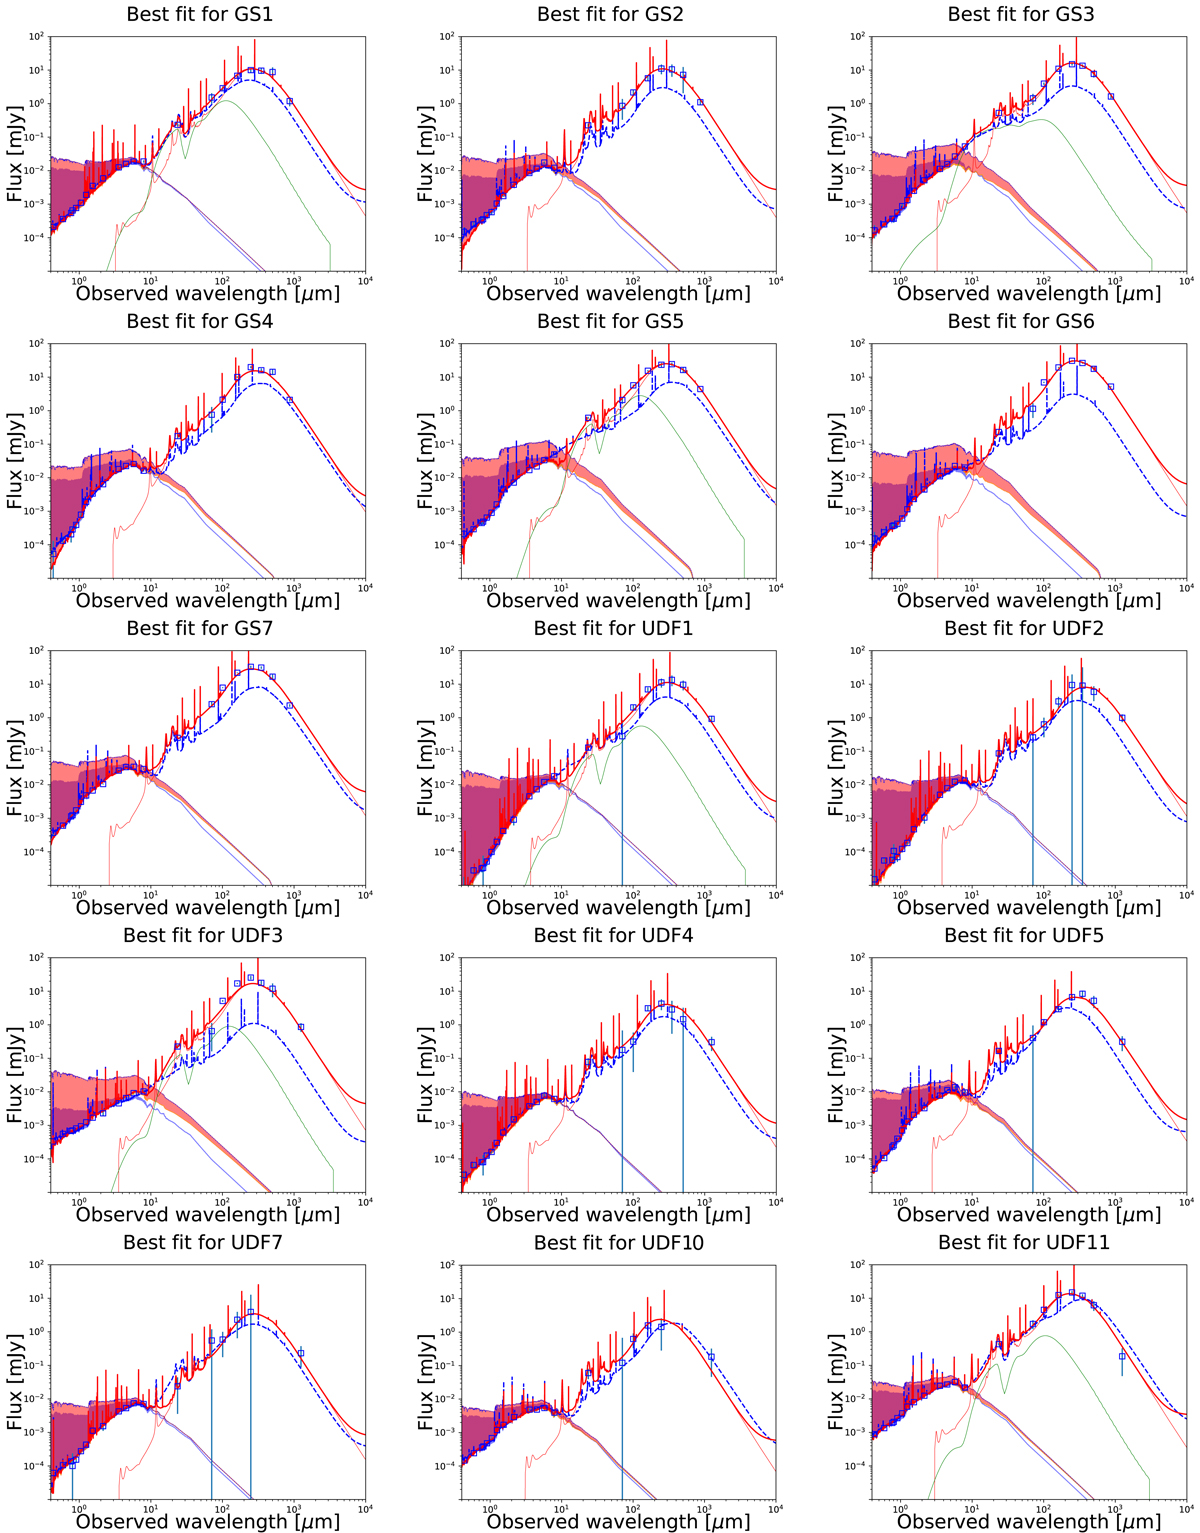
Best fits obtained for each galaxy of our sample. The observed fluxes (y-axis) are plotted against the effective wavelength of each filter (x-axis). The solid red line represents the spectrum of the best fit obtained with the full SED as described in Sect. 4.3, with the best attenuation law listed in Table 2, Col. 4. The dashed blue line represents the spectrum corresponding to the best fit of the stellar continuum (Sect. 4.1) extending to IR and submm to show the dust emission predicted. The AGN component, if any, is plotted with a thin green line. The intrinsic, unabsorbed, stellar continuum of each best fit are plotted with a thin blue line, the shaded areas indicate the corresponding amount of attenuation (in red for the fit of the full SED, in blue for the fit of the stellar continuum). The data points are plotted with empty blue squares and their 3σ error with blue vertical lines.
Current usage metrics show cumulative count of Article Views (full-text article views including HTML views, PDF and ePub downloads, according to the available data) and Abstracts Views on Vision4Press platform.
Data correspond to usage on the plateform after 2015. The current usage metrics is available 48-96 hours after online publication and is updated daily on week days.
Initial download of the metrics may take a while.