Open Access
Fig. 12.
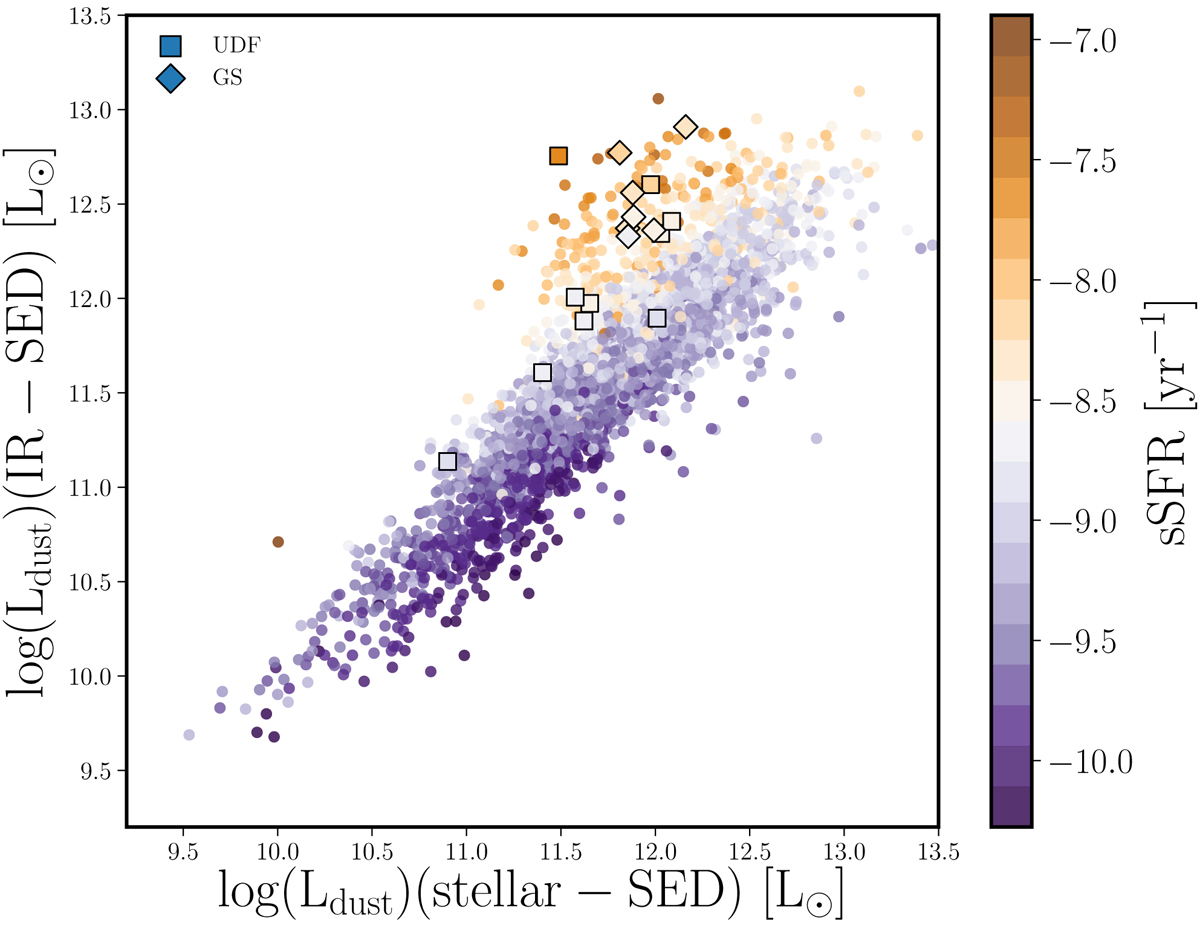
Comparison between Ldust estimated from the fit of the stellar continuum (x-axis) and with IR data (y-axis) as in Fig. 8. Diamonds are used to represent GS galaxies and UDF galaxies are plotted with squares. The COSMOS sample is plotted with dots. The symbols are color coded with sSFR.
Current usage metrics show cumulative count of Article Views (full-text article views including HTML views, PDF and ePub downloads, according to the available data) and Abstracts Views on Vision4Press platform.
Data correspond to usage on the plateform after 2015. The current usage metrics is available 48-96 hours after online publication and is updated daily on week days.
Initial download of the metrics may take a while.