Fig. 11.
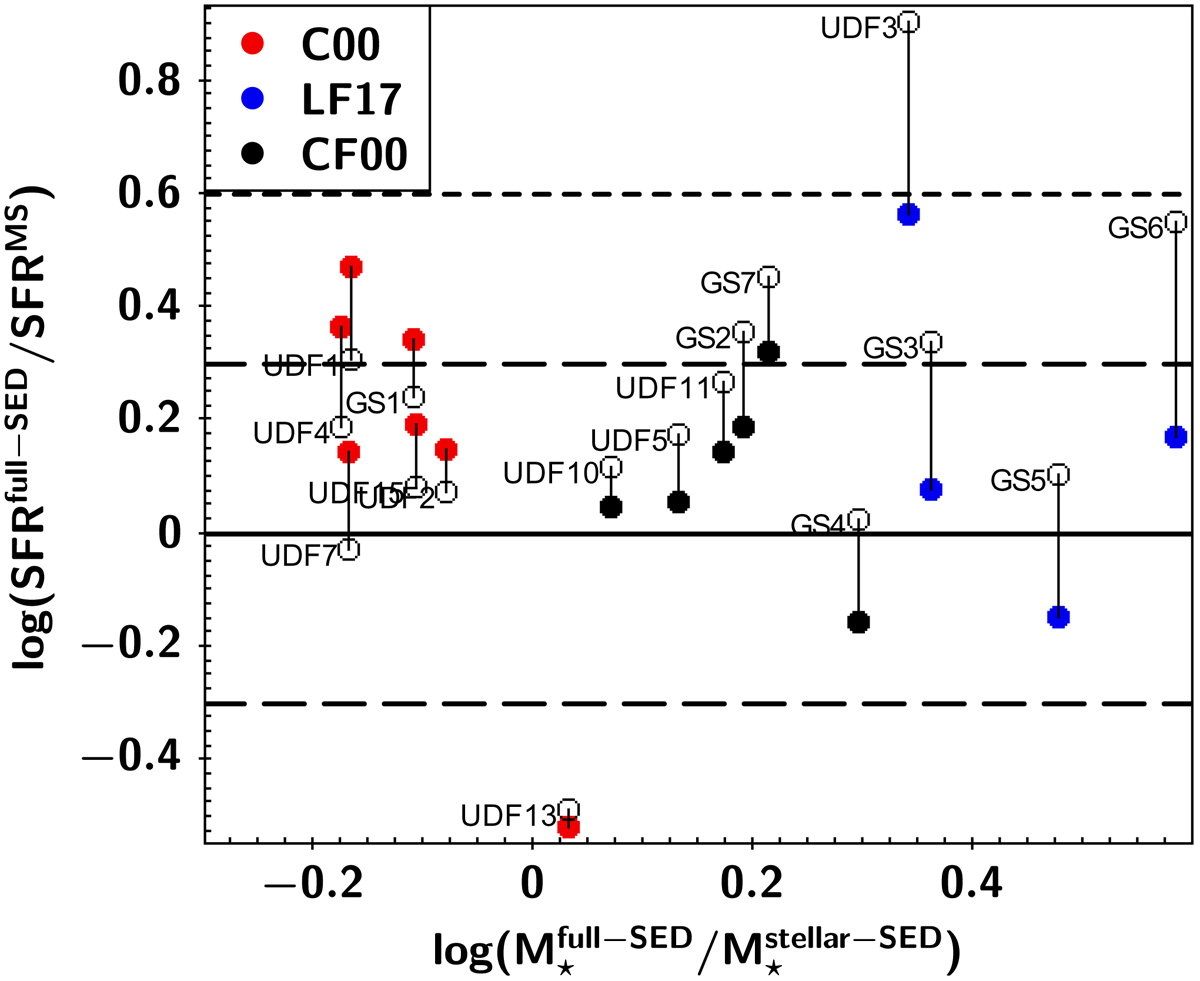
Relative position of the galaxies on the MS. The ratio of stellar masse (M⋆) measured with the fit of the full SED and of the stellar continuum is shown on the x-axis. The y-axis shows the ratio of SFR measured with the fit of the full SED and SFR calculated on the MS. The latter is calculated with the Schreiber et al. (2015) relations using either the stellar mass measured with the fit of the stellar continuum only (empty circles) or with the fit of the full SED (filled circles, red for C00, blue for LF17, and black for CF00). Vertical lines connect the two SFR ratios calculated with the different stellar mass estimations for each galaxy.
Current usage metrics show cumulative count of Article Views (full-text article views including HTML views, PDF and ePub downloads, according to the available data) and Abstracts Views on Vision4Press platform.
Data correspond to usage on the plateform after 2015. The current usage metrics is available 48-96 hours after online publication and is updated daily on week days.
Initial download of the metrics may take a while.