Free Access
Fig. 5.
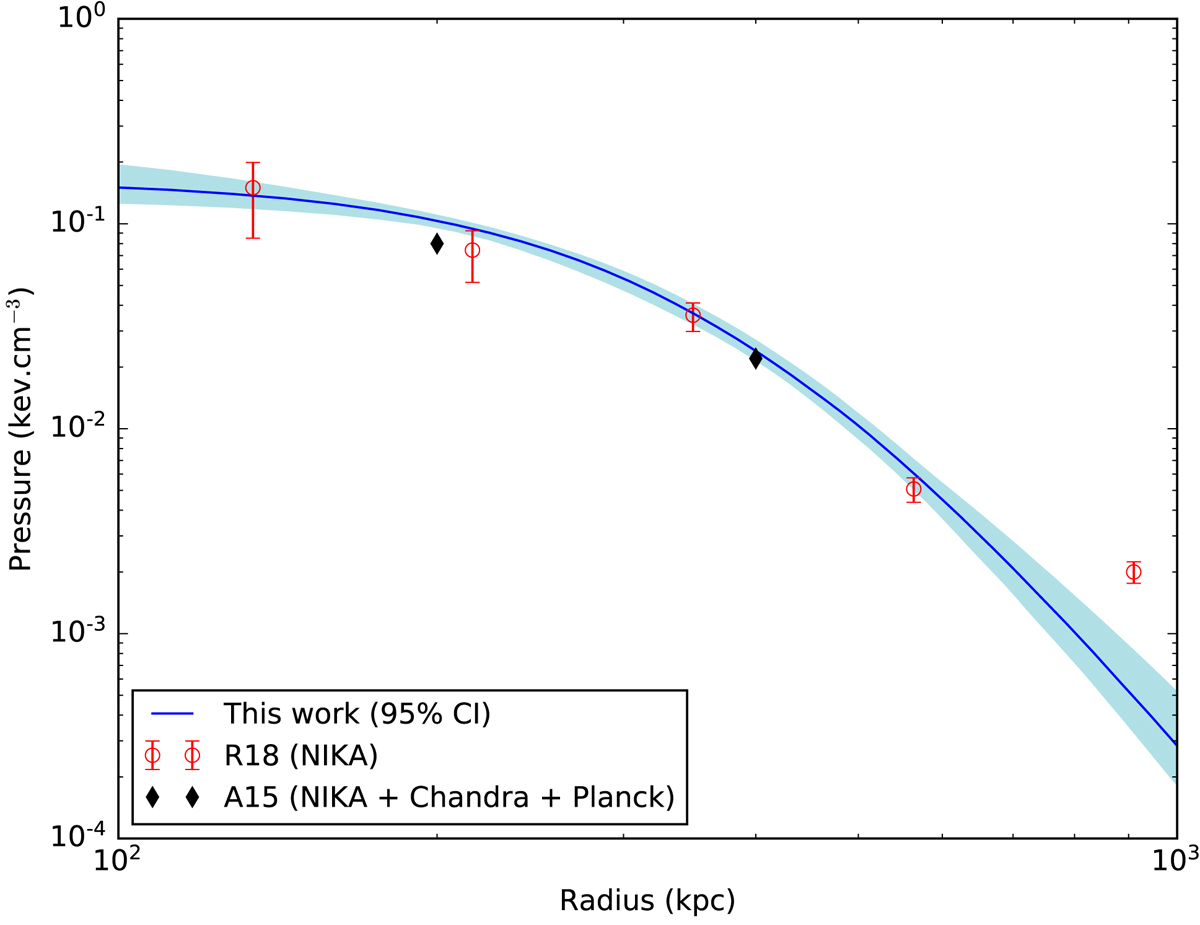
Comparison of CL J1226.9+3332 pressure profiles. Our best fit is plotted in blue (95% CI shaded); the red points are from the non-parametric fit of Romero et al. (2018) on NIKA data (68% error bars); the black diamonds without error bars refer to the fit of Adam et al. (2015) on NIKA, Chandra, and Planck data.
Current usage metrics show cumulative count of Article Views (full-text article views including HTML views, PDF and ePub downloads, according to the available data) and Abstracts Views on Vision4Press platform.
Data correspond to usage on the plateform after 2015. The current usage metrics is available 48-96 hours after online publication and is updated daily on week days.
Initial download of the metrics may take a while.