Fig. 9.
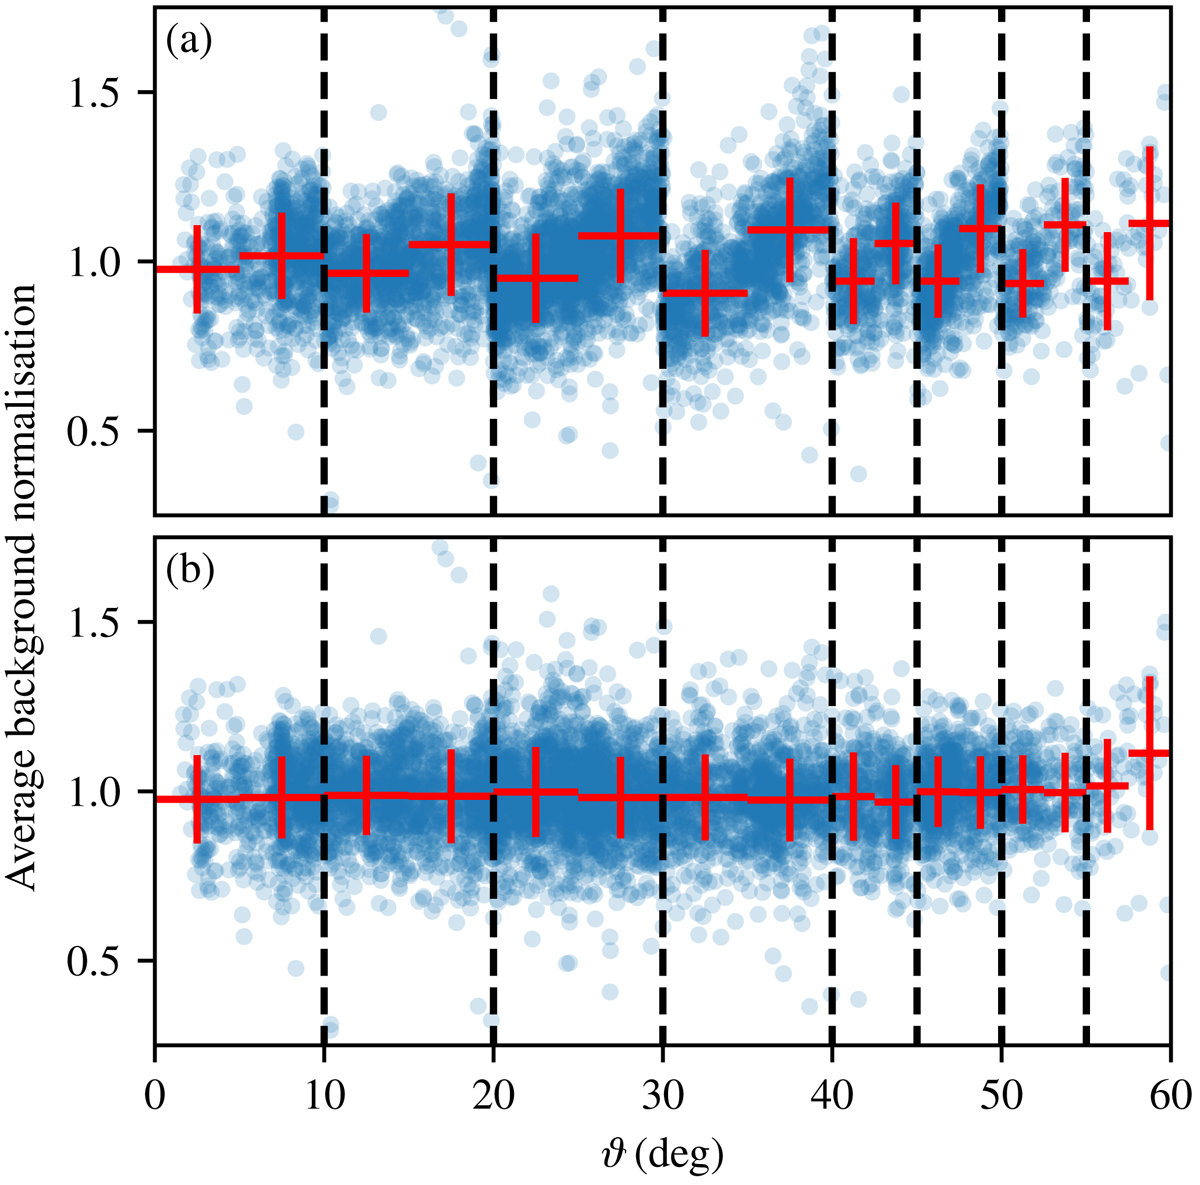
Average fitted background model normalisation as a function of zenith angle ϑ: (a) without zenith-angle interpolation; (b) with zenith-angle interpolation. The normalisation averaged over energy bins is shown for all observations used in the model construction. Boundaries between zenith angle bins as used in the construction of the model are marked by the black dashed lines. The blue markers show the individual observations, whereas the red data points denote the mean and standard deviation in bins of ϑ.
Current usage metrics show cumulative count of Article Views (full-text article views including HTML views, PDF and ePub downloads, according to the available data) and Abstracts Views on Vision4Press platform.
Data correspond to usage on the plateform after 2015. The current usage metrics is available 48-96 hours after online publication and is updated daily on week days.
Initial download of the metrics may take a while.