Fig. C.6.
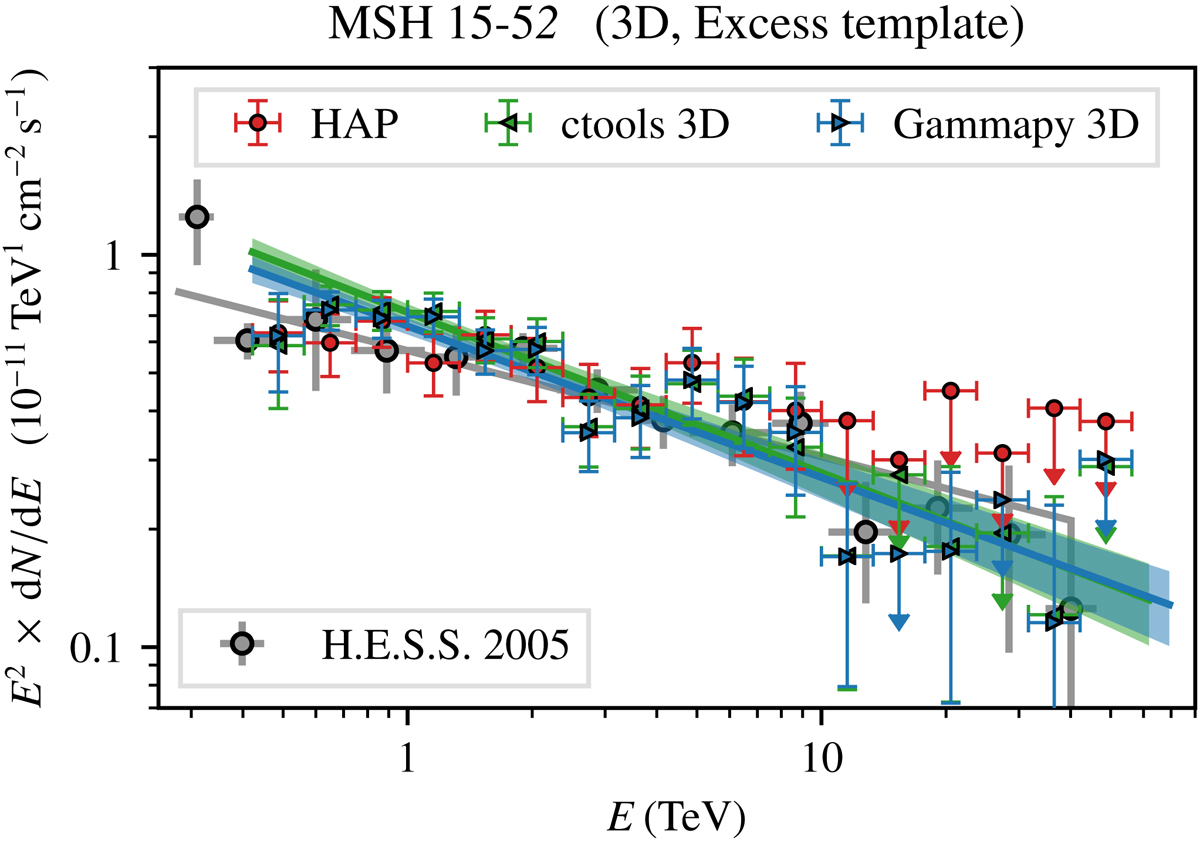
Comparison of spectra for MSH 15−52. The spectra shown in green and blue were derived using a 3D likelihood analysis with ctools and Gammapy, respectively, employing an excess template as source model. The butterflies show the fitted power laws. The results are compared to those obtained with the reflected background method using the HAP software (in red). The published spectrum is taken from Aharonian et al. (2005b).
Current usage metrics show cumulative count of Article Views (full-text article views including HTML views, PDF and ePub downloads, according to the available data) and Abstracts Views on Vision4Press platform.
Data correspond to usage on the plateform after 2015. The current usage metrics is available 48-96 hours after online publication and is updated daily on week days.
Initial download of the metrics may take a while.