Fig. C.5.
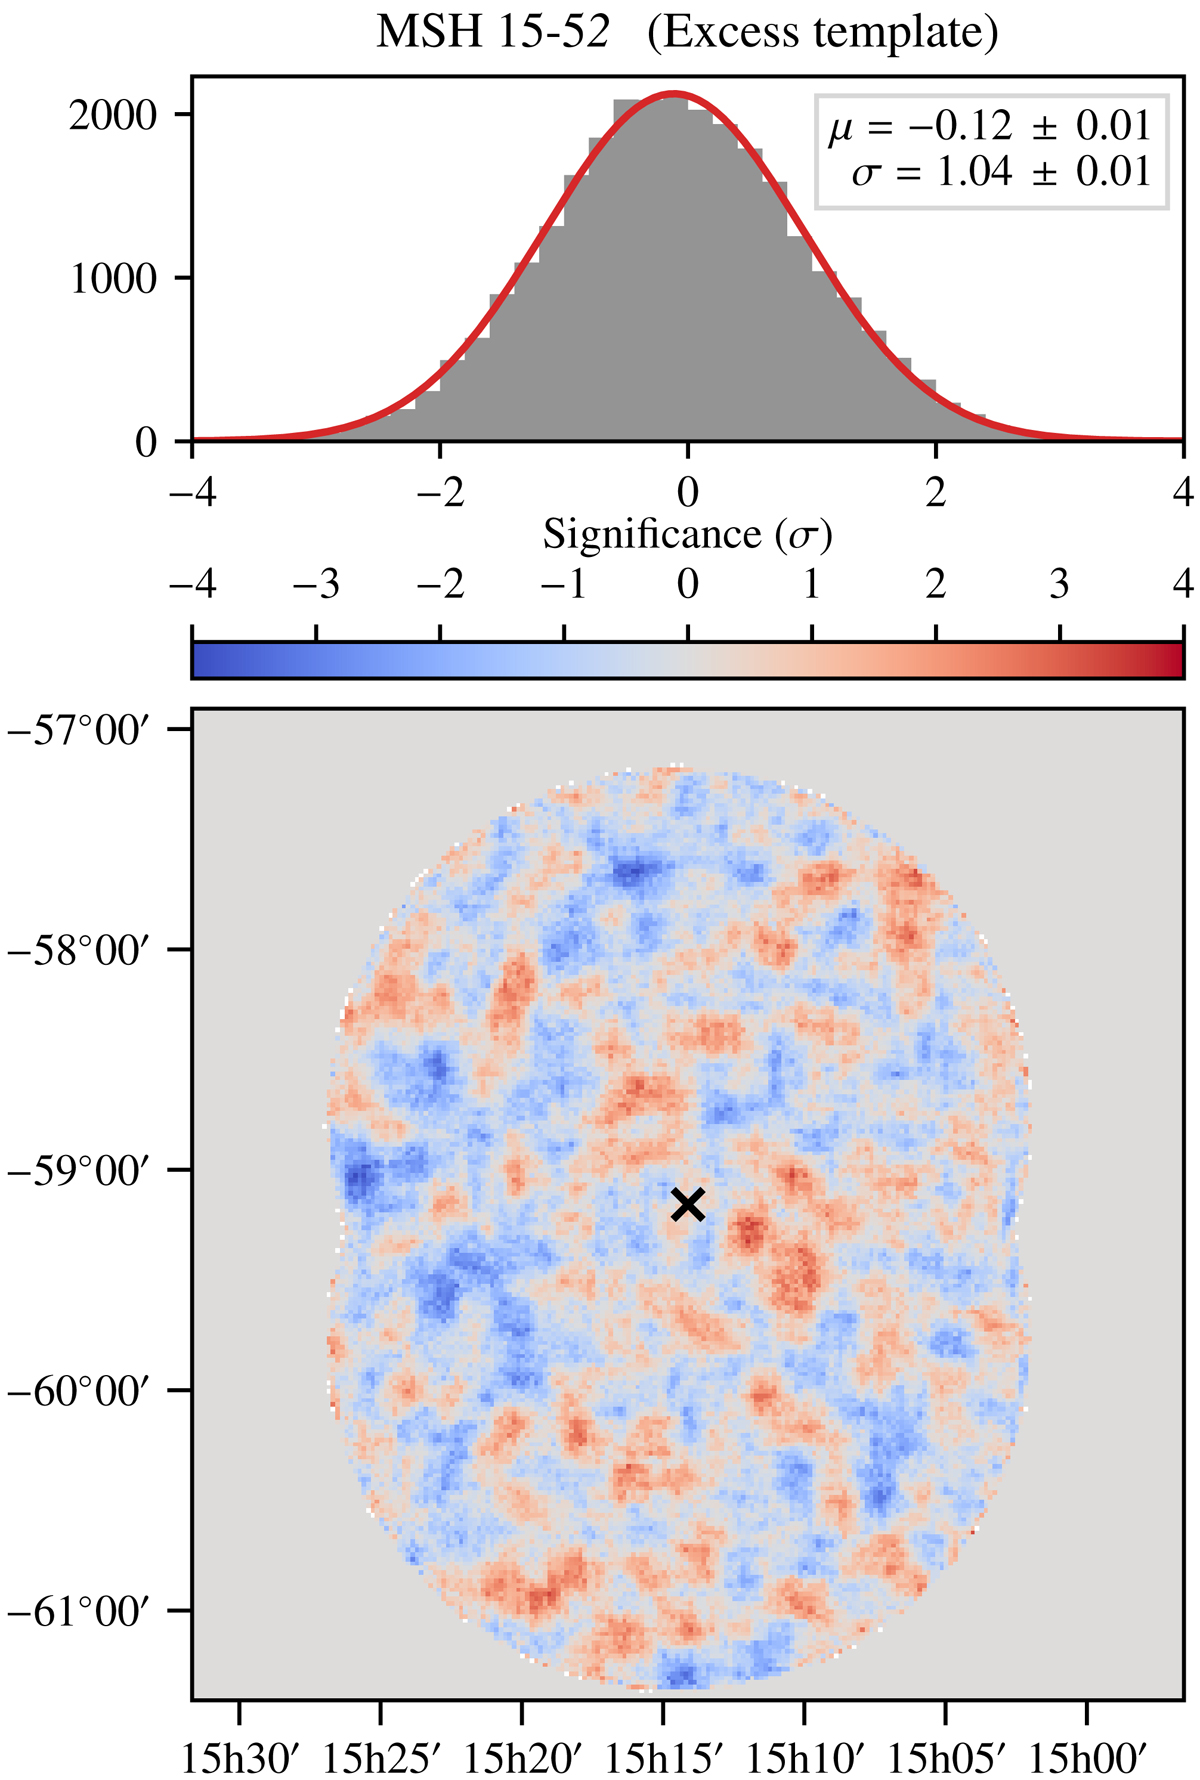
Residual significance map for MSH 15−52, in equatorial coordinates (J2000). Results derived with the 3D likelihood analysis with ctools using an excess template as source model are displayed. We apply a convolution with a top-hat kernel of 0.1° radius to reduce statistical fluctuations. The position of MSH 15−52 is indicated by the “×”. Upper panel: distribution of significance values, together with the fit of a normal distribution (red line).
Current usage metrics show cumulative count of Article Views (full-text article views including HTML views, PDF and ePub downloads, according to the available data) and Abstracts Views on Vision4Press platform.
Data correspond to usage on the plateform after 2015. The current usage metrics is available 48-96 hours after online publication and is updated daily on week days.
Initial download of the metrics may take a while.