Fig. 7.
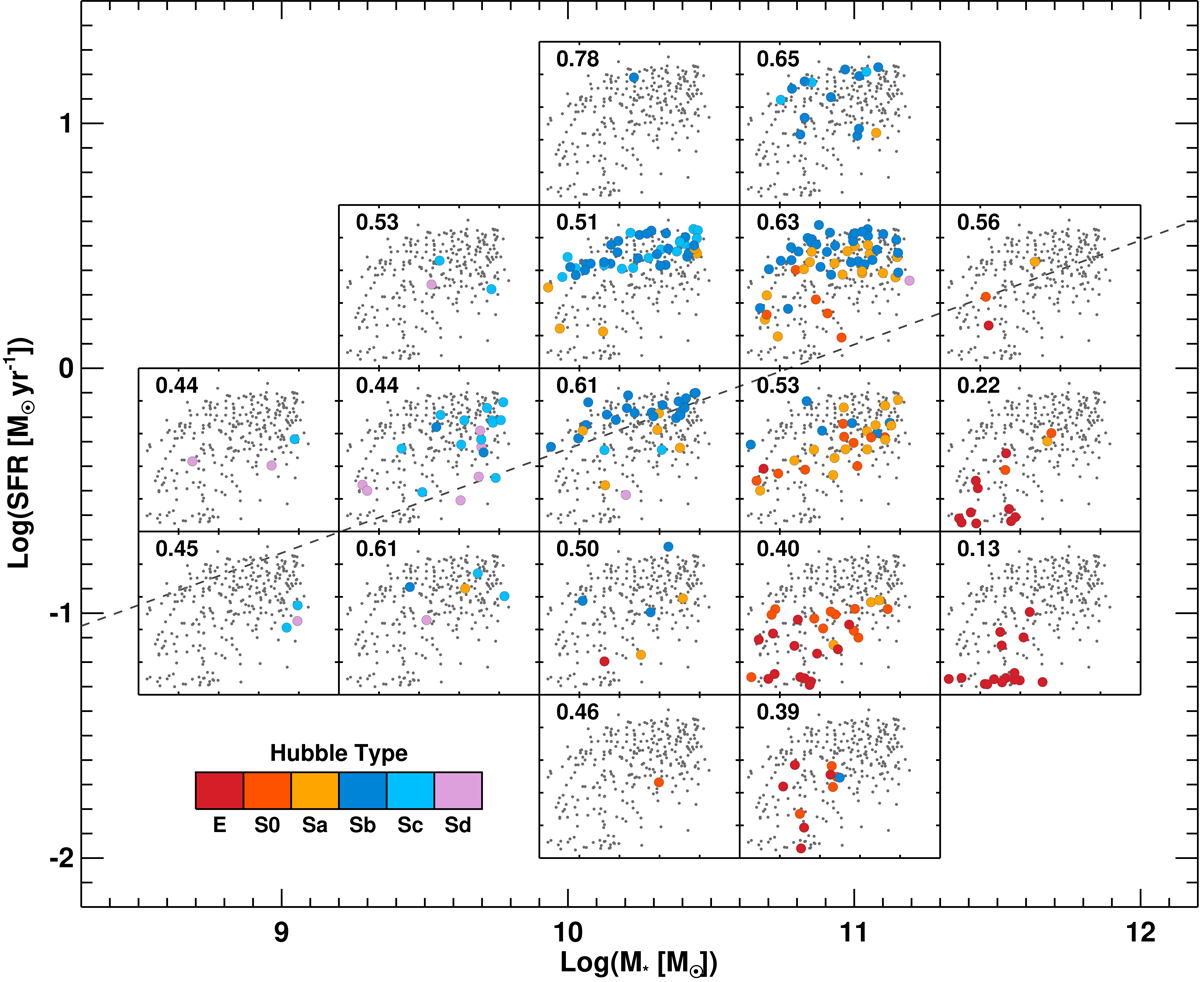
λRe–ϵ relation as a function of location in the star-formation rate versus total stellar mass (M⋆) relation for the CALIFA galaxies. Each panel shows the complete sample highlighting in color the ones belonging to each specific SFR–M⋆ bin. The number in each subpanel gives the ![]() -weighted λRe average for the highlighted galaxies in that bin. The dark gray dashed line in the SFR versus M⋆ on the right marks the division between the main star-forming sequence and quiescent galaxies from Renzini & Peng (2015).
-weighted λRe average for the highlighted galaxies in that bin. The dark gray dashed line in the SFR versus M⋆ on the right marks the division between the main star-forming sequence and quiescent galaxies from Renzini & Peng (2015).
Current usage metrics show cumulative count of Article Views (full-text article views including HTML views, PDF and ePub downloads, according to the available data) and Abstracts Views on Vision4Press platform.
Data correspond to usage on the plateform after 2015. The current usage metrics is available 48-96 hours after online publication and is updated daily on week days.
Initial download of the metrics may take a while.