Fig. 6.
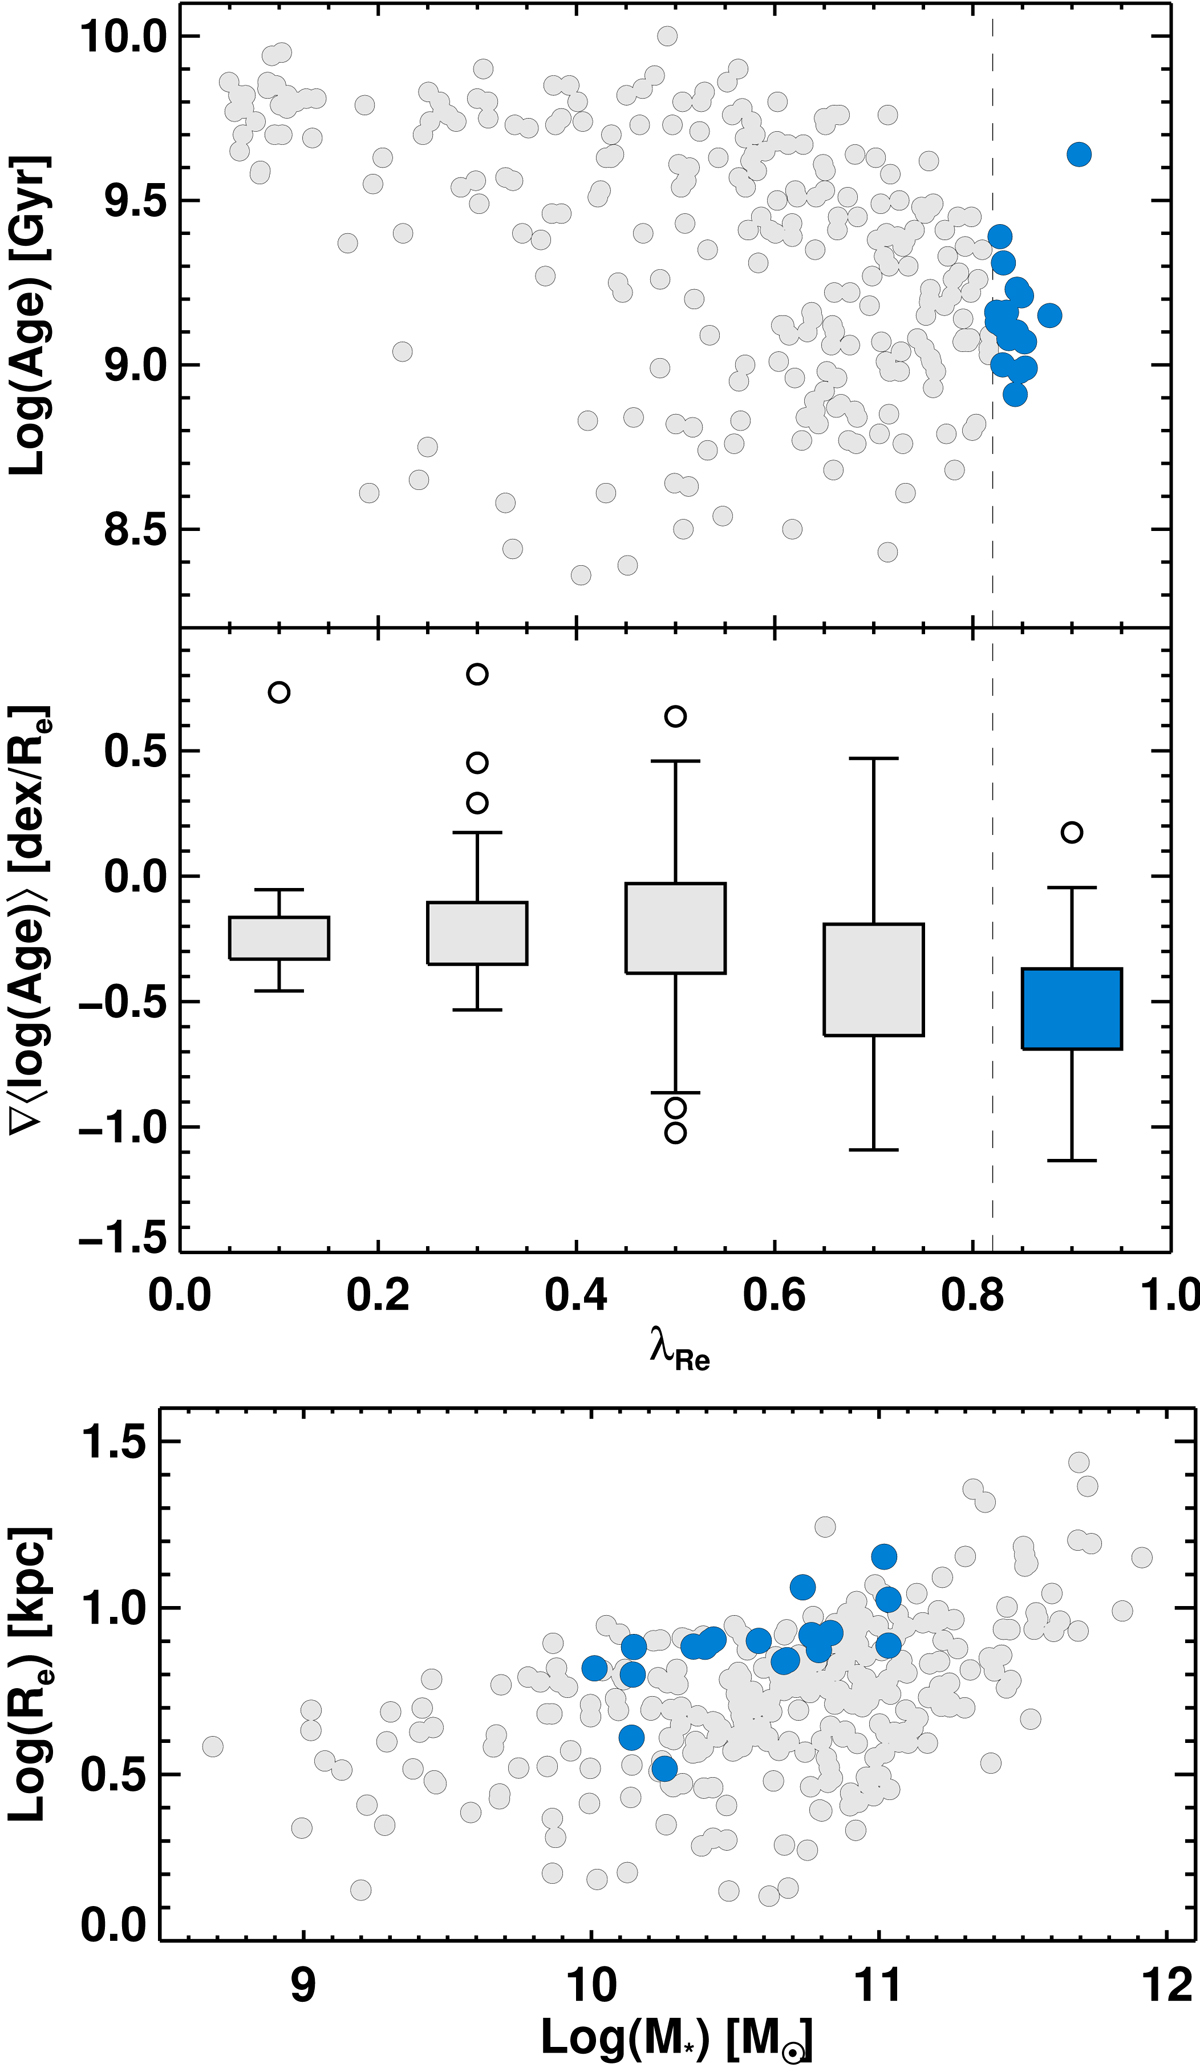
Top and middle panels: λRe relations with mean age within Re, mean stellar age gradient within Re for our sample of CALIFA galaxies. Bottom panel: stellar mass–size relation. The whisker plot in the middle panel was computed in the same way as in Fig. 5. Galaxies above the 95% percentile of λRe distribution of the sample are marked in blue. The dashed line in the top and middle panels marks that percentile.
Current usage metrics show cumulative count of Article Views (full-text article views including HTML views, PDF and ePub downloads, according to the available data) and Abstracts Views on Vision4Press platform.
Data correspond to usage on the plateform after 2015. The current usage metrics is available 48-96 hours after online publication and is updated daily on week days.
Initial download of the metrics may take a while.