Fig. 5.
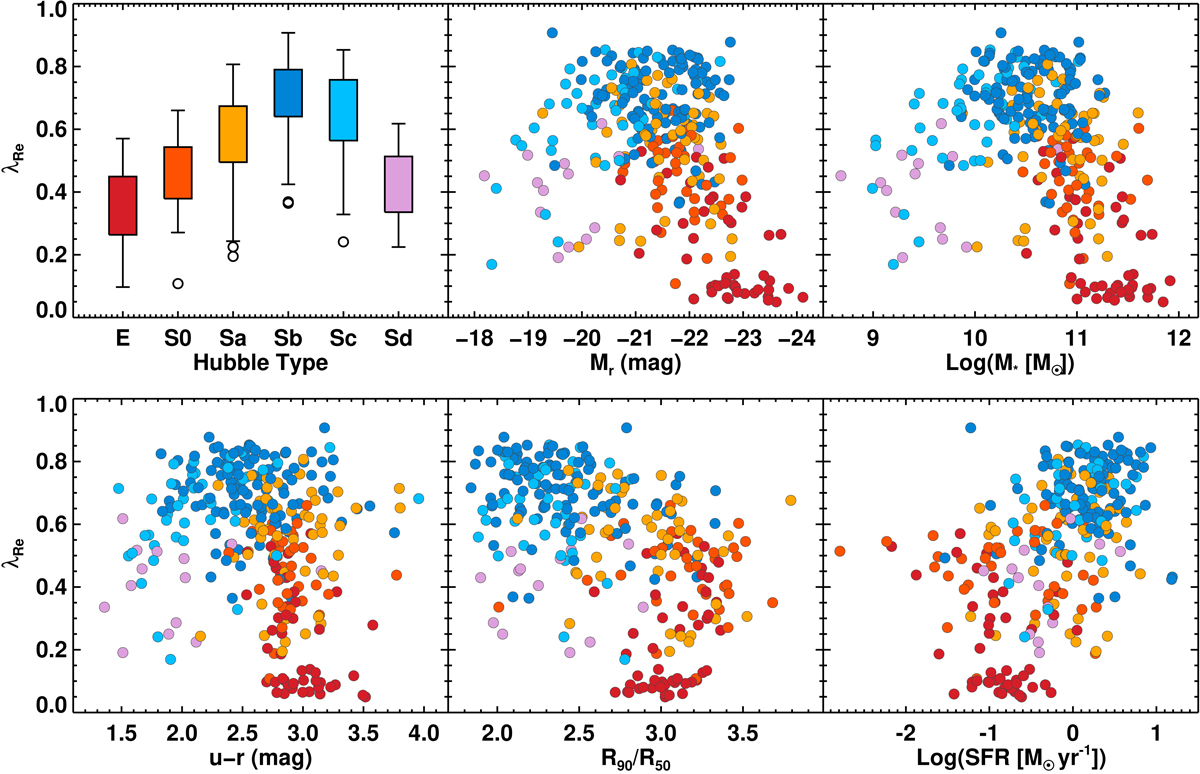
λRe relations with global parameters for the sample of 300 CALIFA galaxies. Galaxies are color-coded with Hubble type. Top left panel: whisker plot enclosing the interquartile range (IQR), defined at IQR25%–IQR75% for galaxies of each morphological type. The whiskers extend out to the maximum or minimum value of the data, or to 1.5 times IQR25% or IQR75% in case there is data beyond this range. Outliers are identified with small circles. Other panels: relations with r-band absolute magnitude Mr, total stellar mass M⋆, u − r Petrosian color, concentration index R90/R50, and star formation rate SFR. See text for details.
Current usage metrics show cumulative count of Article Views (full-text article views including HTML views, PDF and ePub downloads, according to the available data) and Abstracts Views on Vision4Press platform.
Data correspond to usage on the plateform after 2015. The current usage metrics is available 48-96 hours after online publication and is updated daily on week days.
Initial download of the metrics may take a while.