Fig. 4.
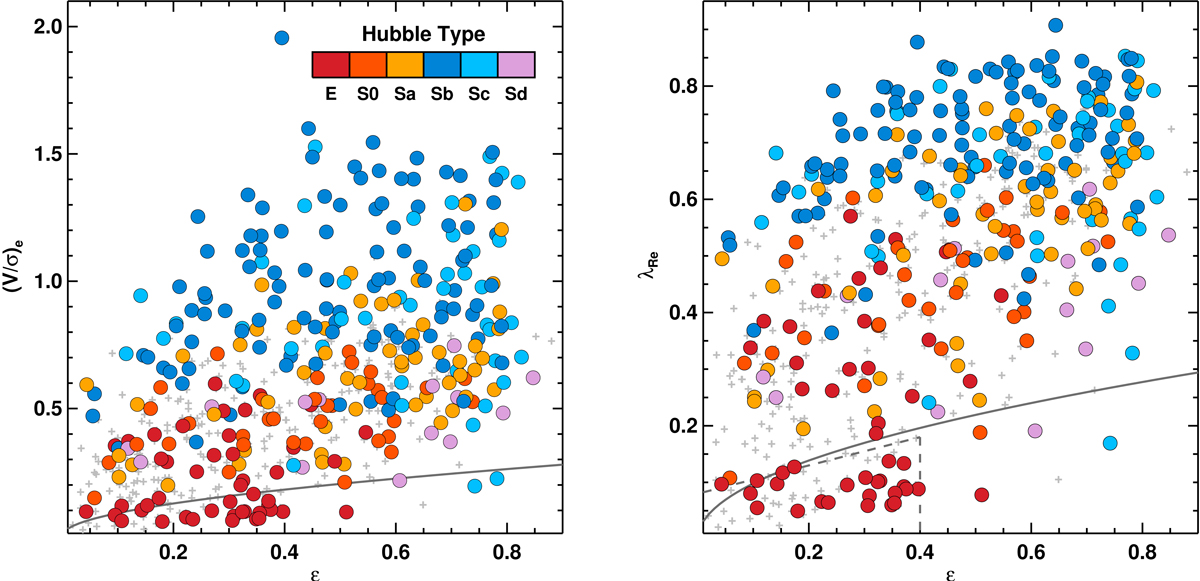
(V/σ, ε)e (left) and (λRe, ε) (right) relations for the CALIFA sample of 300 galaxies. Galaxies are color-coded with Hubble type as indicated by the colorbar. For reference, we plot the ATLAS3D sample with gray crosses. The solid line demarcates the division between Slow and Fast rotators as established by Emsellem et al. (2011). The dashed line in the right panel marks the revised division between Slow and Fast rotators defined by Cappellari (2016).
Current usage metrics show cumulative count of Article Views (full-text article views including HTML views, PDF and ePub downloads, according to the available data) and Abstracts Views on Vision4Press platform.
Data correspond to usage on the plateform after 2015. The current usage metrics is available 48-96 hours after online publication and is updated daily on week days.
Initial download of the metrics may take a while.