Fig. 2.
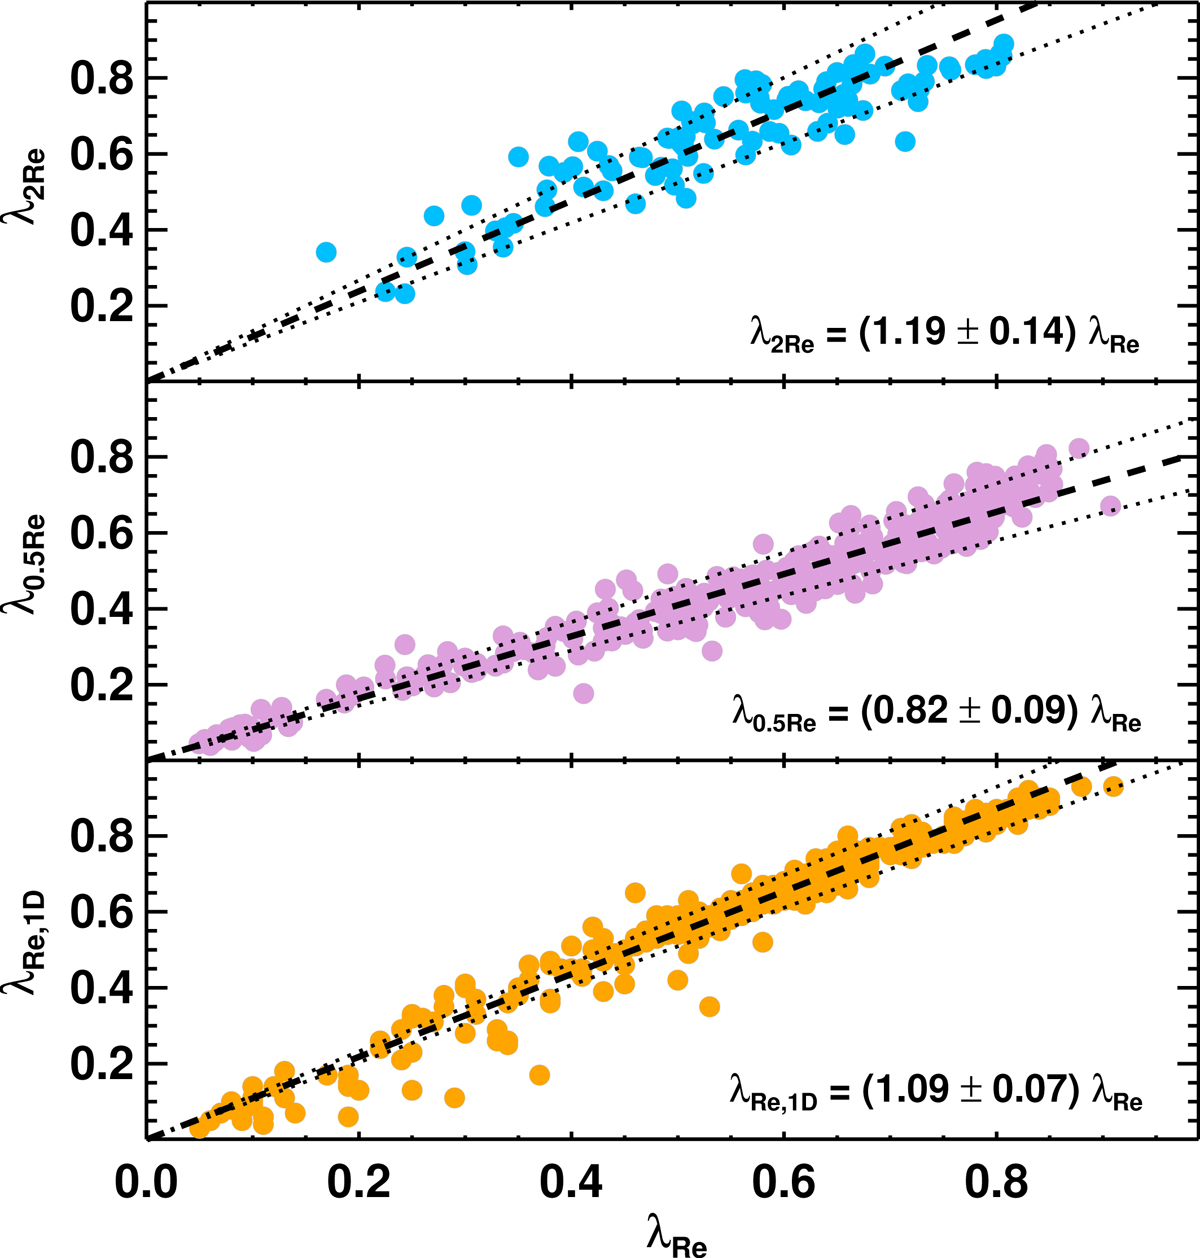
Stellar angular momentum (λR) aperture relations for different aperture sizes. Top and middle panels: relation between λRe with the values of smaller/larger apertures 0.5 Re and 2 Re. Bottom panel: comparison of λRe with that computed with a 1D long-slit along the major axis of the galaxies. The dashed lines indicate the biweight mean values while dotted lines indicate the standard deviation.
Current usage metrics show cumulative count of Article Views (full-text article views including HTML views, PDF and ePub downloads, according to the available data) and Abstracts Views on Vision4Press platform.
Data correspond to usage on the plateform after 2015. The current usage metrics is available 48-96 hours after online publication and is updated daily on week days.
Initial download of the metrics may take a while.