Fig. 8
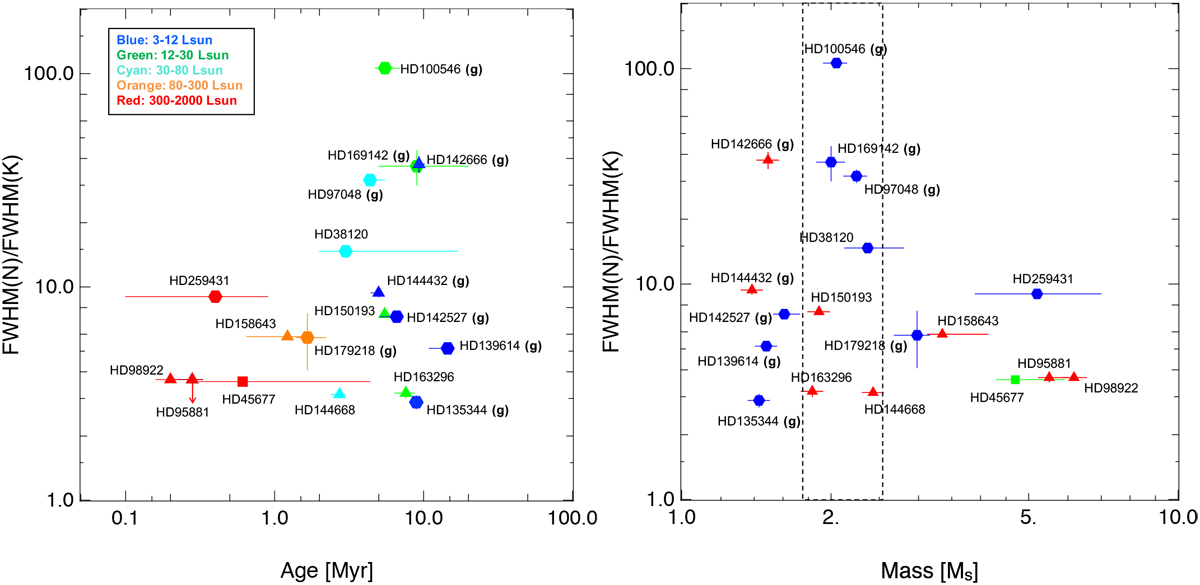
N-to-K ratio as function of age and mass. The triangle symbol shows group-II sources, diamond symbol shows group-I sources and the square symbol shows objects with no classification (i.e., HD 45677). In the left plot, the different colors correspond to different luminosity classes as shown in the inset. In the right plot, blue diamonds identify group-I sources and red triangles group-II sources. Identified gapped sources by high angular resolution observations are marked with (g). The object R CrA (#13 in Table 4) is not represented here as no age estimate is reported in Vioque et al. (2018).
Current usage metrics show cumulative count of Article Views (full-text article views including HTML views, PDF and ePub downloads, according to the available data) and Abstracts Views on Vision4Press platform.
Data correspond to usage on the plateform after 2015. The current usage metrics is available 48-96 hours after online publication and is updated daily on week days.
Initial download of the metrics may take a while.