Fig. 7
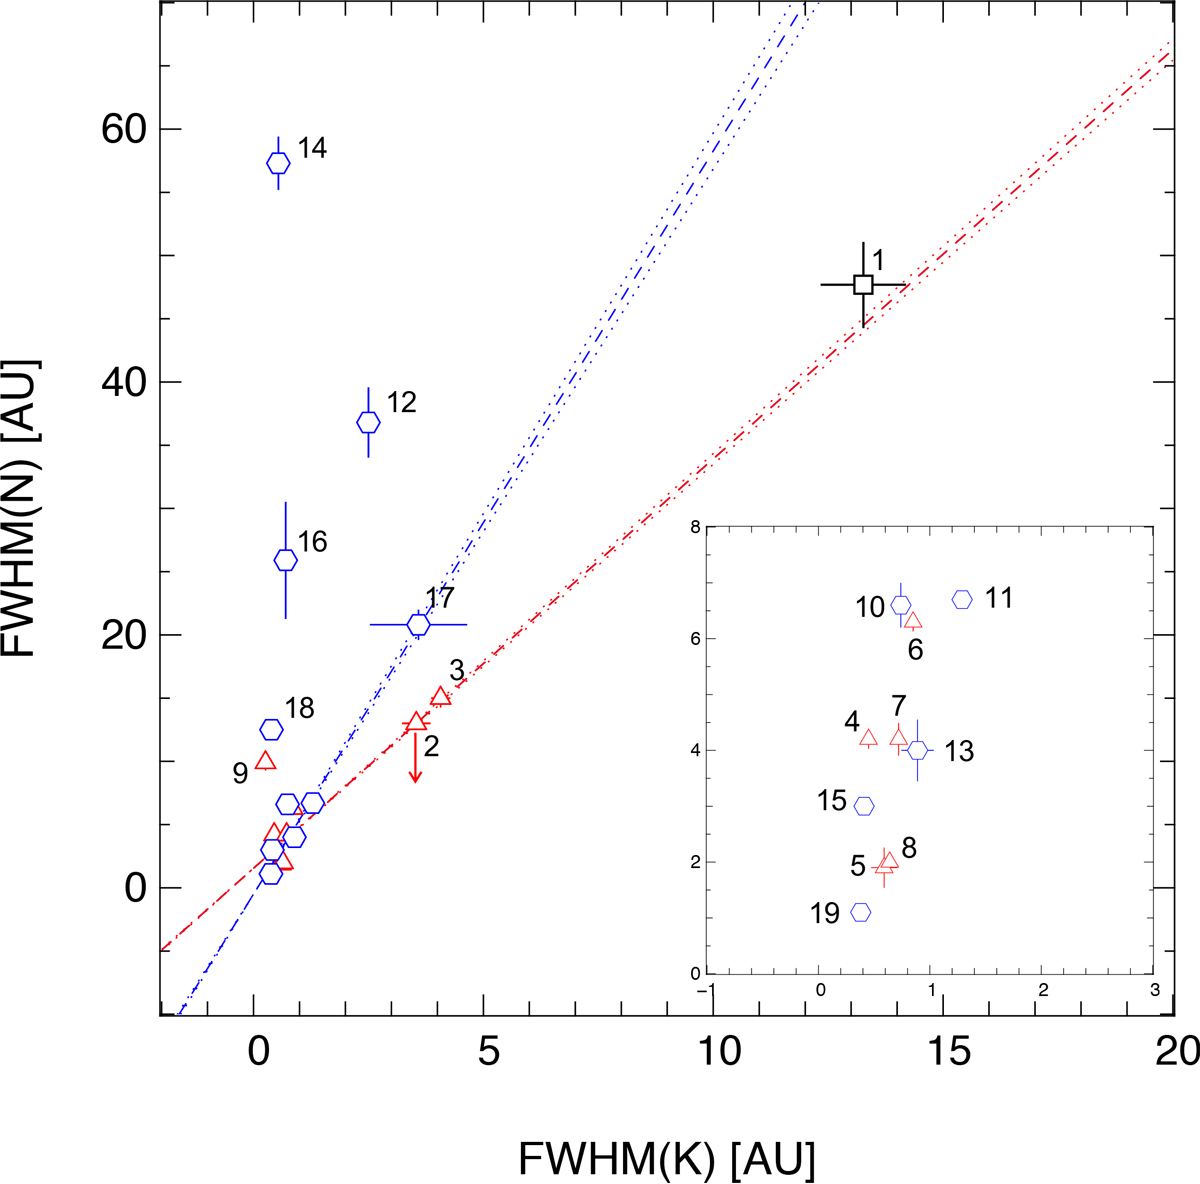
Size-size diagram of FWHM in N- and K-bands for group I (blue), group II (red), and unclassified (black) sources. The numbering refers to Table 4. Blue and red dashed lines correspondto an error-bar-weighted linear regression on the group I and group II sources, respectively: y = ax + b with aI = 5.87 ± 0.14, bI = −0.50 ± 0.08, aII = 3.23 ± 0.04, bII = 1.54 ± 0.09. The dotted lines delimit the uncertainty on the slope parameters. The inset shows a zoom of the overlap region (see text for details).
Current usage metrics show cumulative count of Article Views (full-text article views including HTML views, PDF and ePub downloads, according to the available data) and Abstracts Views on Vision4Press platform.
Data correspond to usage on the plateform after 2015. The current usage metrics is available 48-96 hours after online publication and is updated daily on week days.
Initial download of the metrics may take a while.