Fig. 6
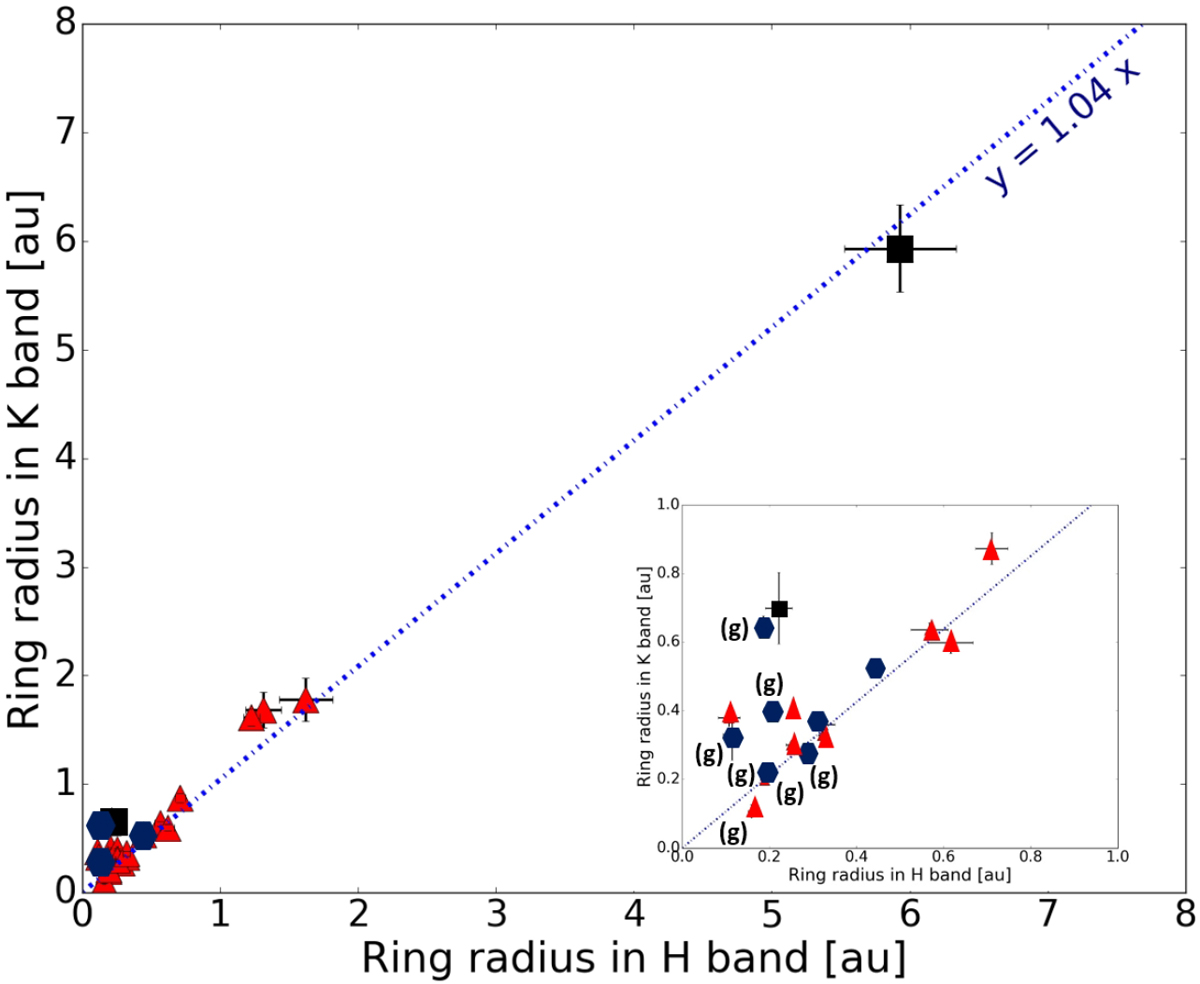
Comparison of half-flux radii of ring models in H and K-bands as determined by PIONIER and GRAVITY observations (see Table E.1). Blue diamonds denote group-I sources, while the red triangles denote group-II sources. The gapped sources are marked with (g). The dash-dotted line is the resulting linear regression. The inset is a zoom on the smallest ring radii.
Current usage metrics show cumulative count of Article Views (full-text article views including HTML views, PDF and ePub downloads, according to the available data) and Abstracts Views on Vision4Press platform.
Data correspond to usage on the plateform after 2015. The current usage metrics is available 48-96 hours after online publication and is updated daily on week days.
Initial download of the metrics may take a while.