Fig. 5
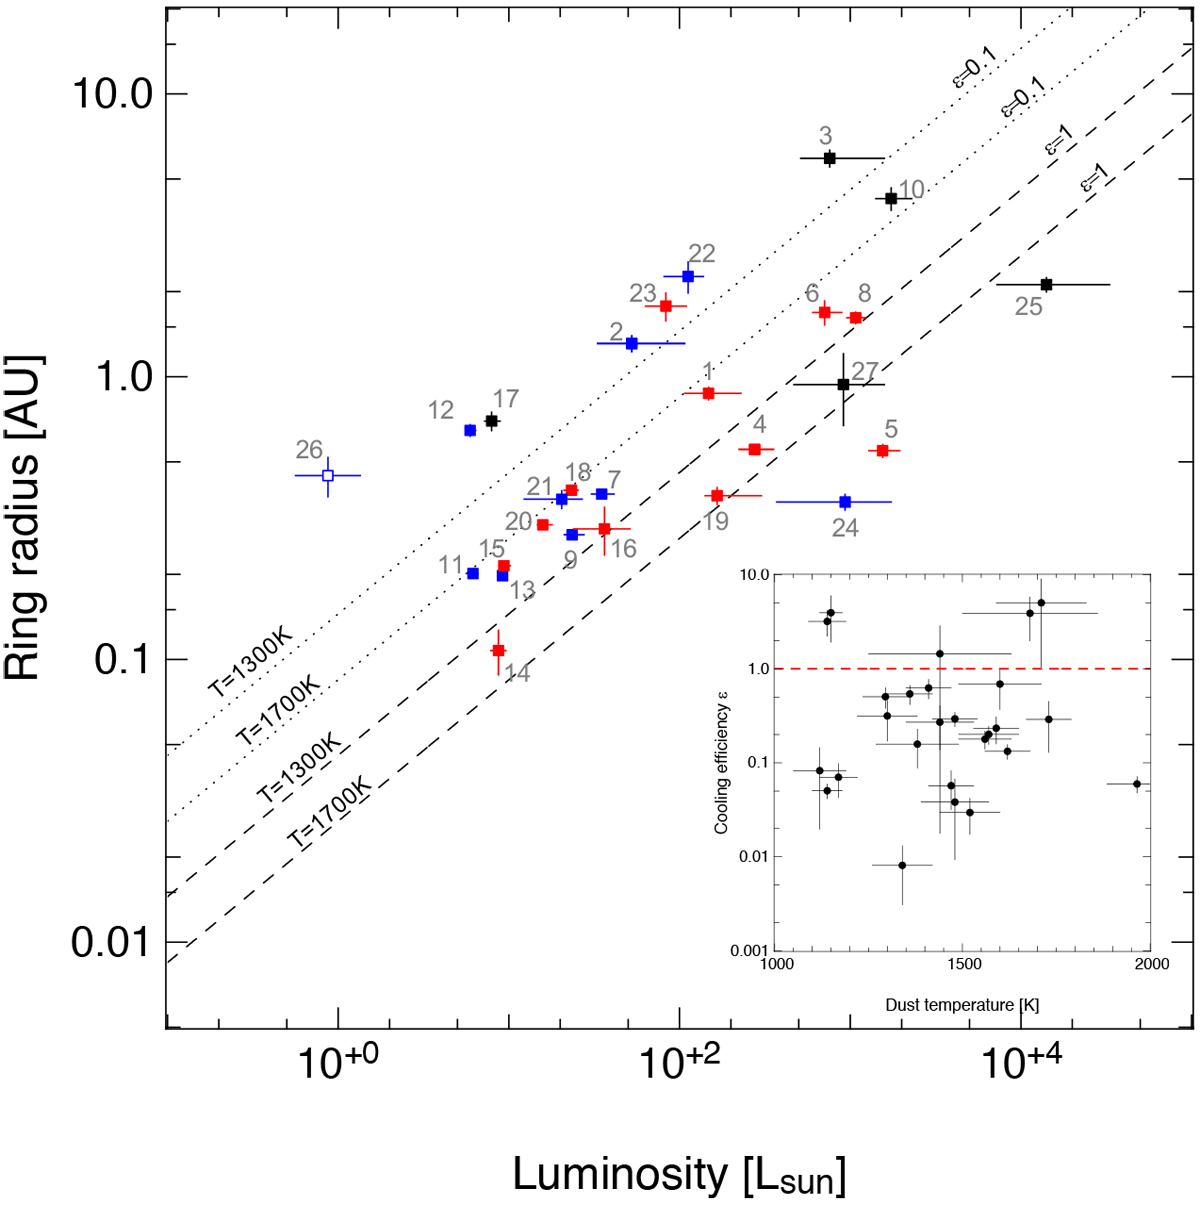
Ring half-flux radius vs. luminosity for group I (blue), group II (red) and unclassified (black) targets. The dashed and dotted lines show the relationship for the labeled temperature and cooling efficiency of the dust ϵg of an optically thin inner cavity model. The inset shows the distribution of values of the dust cooling efficiency ϵ derived from our ring half-flux radii and dust temperatures. The empty symbol (source #26) corresponds to R CrA, a low-quality source in Vioque et al. (2018). The numbering refers to Table 1.
Current usage metrics show cumulative count of Article Views (full-text article views including HTML views, PDF and ePub downloads, according to the available data) and Abstracts Views on Vision4Press platform.
Data correspond to usage on the plateform after 2015. The current usage metrics is available 48-96 hours after online publication and is updated daily on week days.
Initial download of the metrics may take a while.