Free Access
Fig. 9
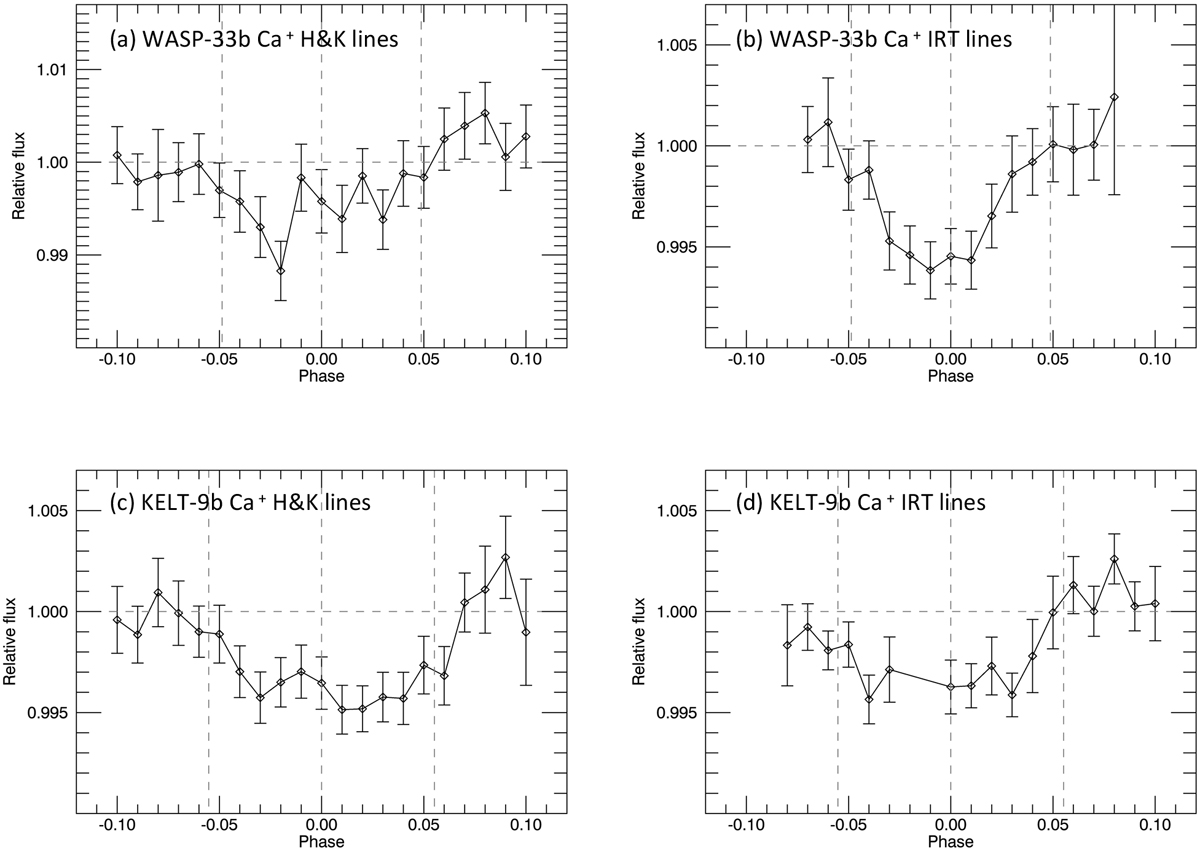
Average light curves of the Ca II H&K lines (left panels) and Ca II IRT lines (right panels). These are relative fluxes measured with an 1 Å band centered at the line core. The measurement was performed in the planetary rest frame and the stellar RM+CLV effects were corrected.
Current usage metrics show cumulative count of Article Views (full-text article views including HTML views, PDF and ePub downloads, according to the available data) and Abstracts Views on Vision4Press platform.
Data correspond to usage on the plateform after 2015. The current usage metrics is available 48-96 hours after online publication and is updated daily on week days.
Initial download of the metrics may take a while.