Fig. 8
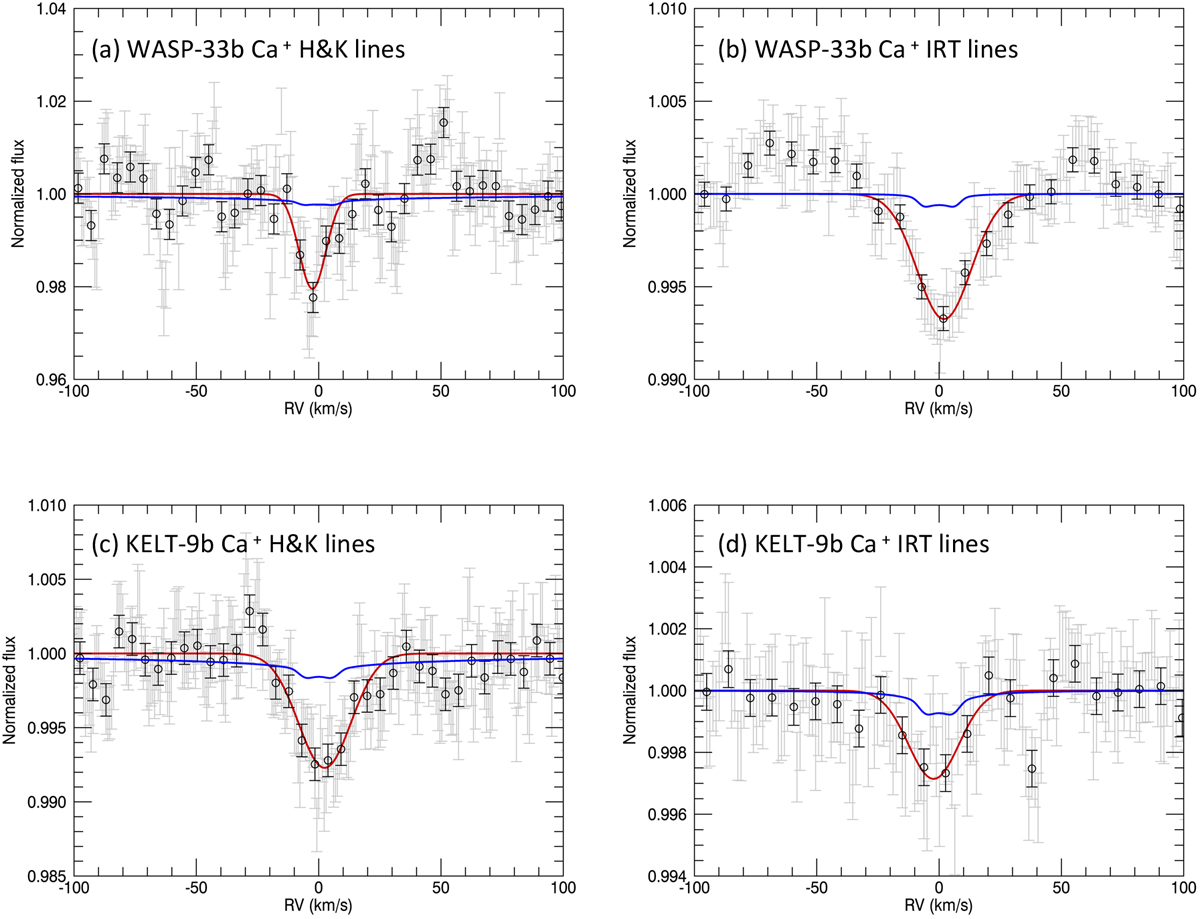
Average line profiles of Ca II H&K (left) and Ca II IRT (right) for WASP-33b (top) and KELT-9b (bottom). The gray points are original transmission spectra and the black circles are spectra binned every seven points. The red lines are Gaussian fits to the line profiles. The fitted results are presented in Table 4. The blue lines are model spectra calculated assuming isothermal temperatures and tidal locked rotation.
Current usage metrics show cumulative count of Article Views (full-text article views including HTML views, PDF and ePub downloads, according to the available data) and Abstracts Views on Vision4Press platform.
Data correspond to usage on the plateform after 2015. The current usage metrics is available 48-96 hours after online publication and is updated daily on week days.
Initial download of the metrics may take a while.