Fig. 6
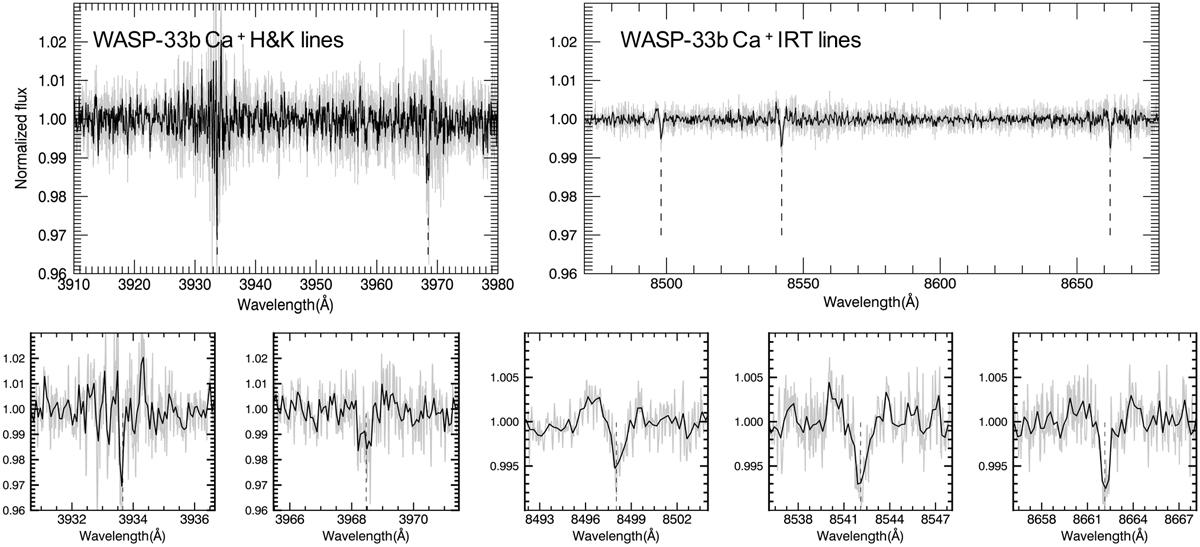
Transmission spectra of the Ca II lines for WASP-33b obtained by combining all the in-transit spectra (excluding ingress and egress). Gray lines denote the original spectra and black lines the binned spectra (7 points bin). Dashed vertical lines indicate the rest wavelengths of the line centers. Upper panels: Ca II H&K and IRT lines plotted with the same y-axis scale. The strength of the H&K lines is significantly greater than that of the IRT lines. Lower panels: enlarged view of eachof the five lines.
Current usage metrics show cumulative count of Article Views (full-text article views including HTML views, PDF and ePub downloads, according to the available data) and Abstracts Views on Vision4Press platform.
Data correspond to usage on the plateform after 2015. The current usage metrics is available 48-96 hours after online publication and is updated daily on week days.
Initial download of the metrics may take a while.