Fig. 4
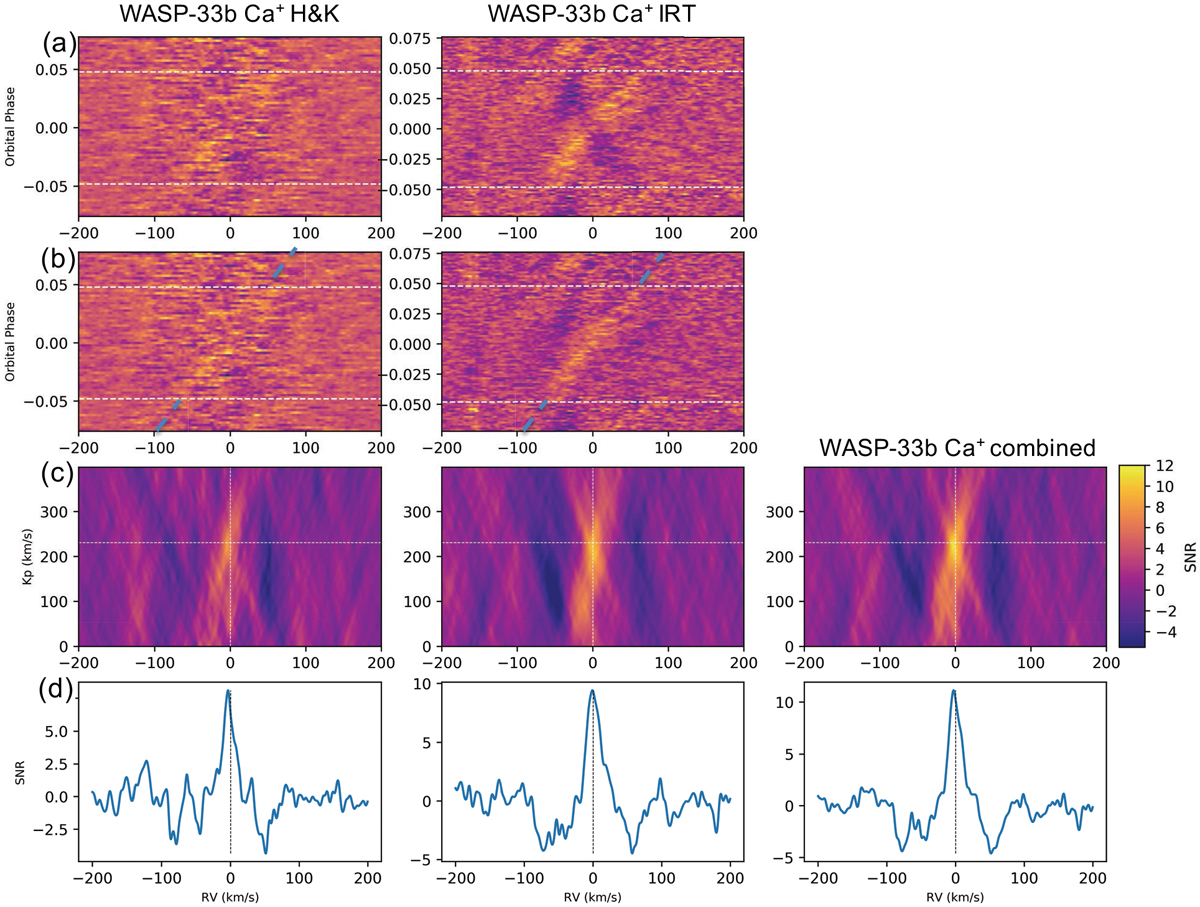
Cross-correlation results of WASP-33b for Ca II H&K (left panels), Ca II IRT (middle panels), and the five lines combined (right panels). (a) The CCF maps without the correction of stellar effects. The two horizontal dashed lines indicate the time of ingress and egress. (b) The CCF maps with stellar RM+CLV effects corrected. The correction of RM+CLV effects was performed on the transmission spectral matrix before the cross-correlation. There is a remaining black stripe at –30 km s−1 in the CCF map of Ca II IRT, which is probably the feature of stellar pulsation because WASP-33 is a variable star. (c) The Kp -map. These are the combined in-transit CCFs for different Kp values. The horizontal dashed line marks the expected Kp calculated using the planetary orbital parameters from the literature. The vertical dashed line marks RV = 0 km s−1, where the planetary signal is expected to be located (we corrected the stellar systemic RV). (d) The CCF at Kp = 231 km s−1 (expected Kp value).
Current usage metrics show cumulative count of Article Views (full-text article views including HTML views, PDF and ePub downloads, according to the available data) and Abstracts Views on Vision4Press platform.
Data correspond to usage on the plateform after 2015. The current usage metrics is available 48-96 hours after online publication and is updated daily on week days.
Initial download of the metrics may take a while.