Fig. 12
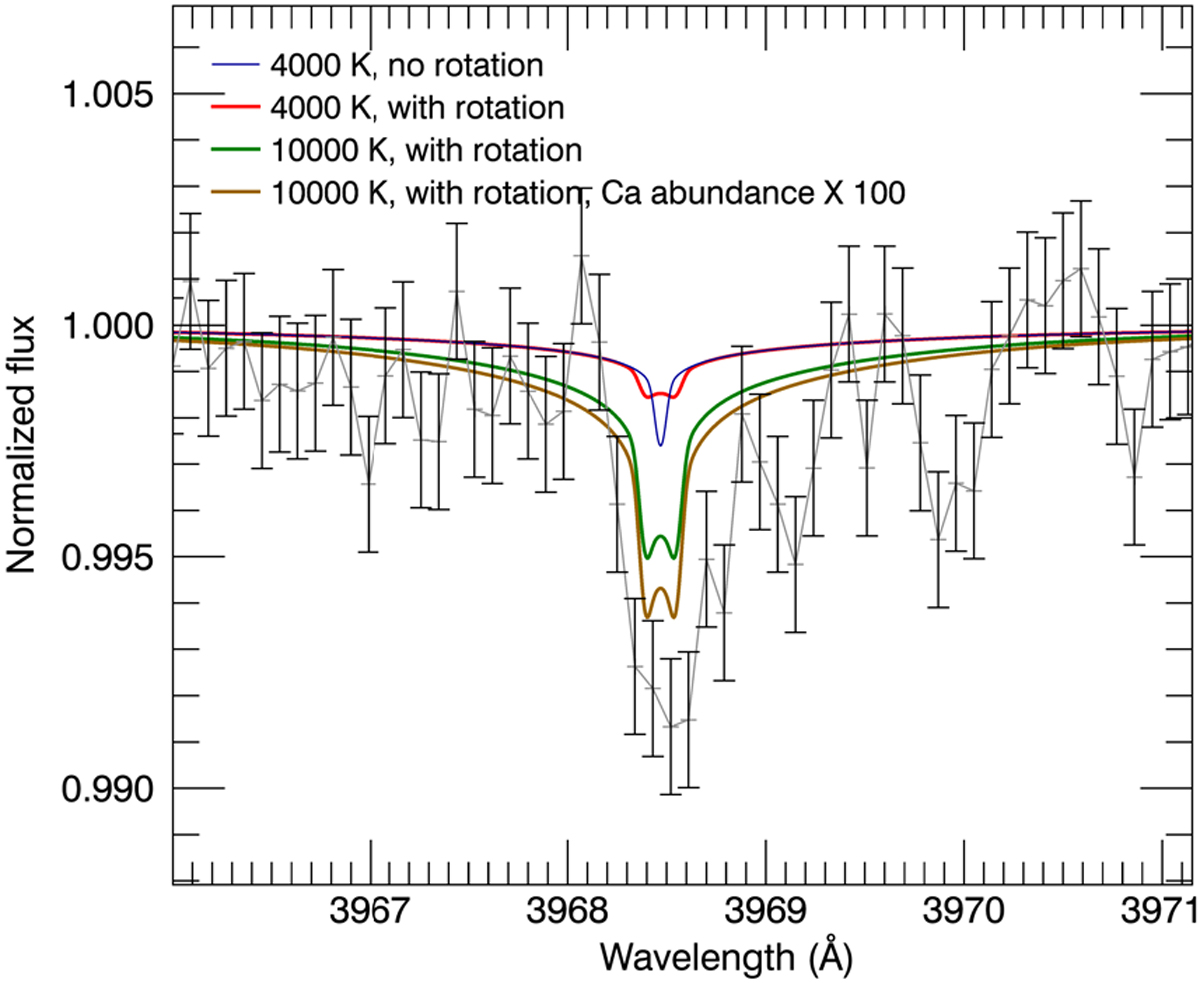
Different models for the Ca II H line absorption for KELT-9b. The black points are the observed transmission spectrum (binned every 7 points). The blue line is the model with a temperature of 4000 K. The red line is the model with rotational broadening included. The green line is the model with a temperature of 10 000 K and the yellow line is with increased Ca abundance. The observed absorption is stronger than the model predictions. Such a strong absorption indicates a hydrodynamic outflow of the material.
Current usage metrics show cumulative count of Article Views (full-text article views including HTML views, PDF and ePub downloads, according to the available data) and Abstracts Views on Vision4Press platform.
Data correspond to usage on the plateform after 2015. The current usage metrics is available 48-96 hours after online publication and is updated daily on week days.
Initial download of the metrics may take a while.