Fig. 8.
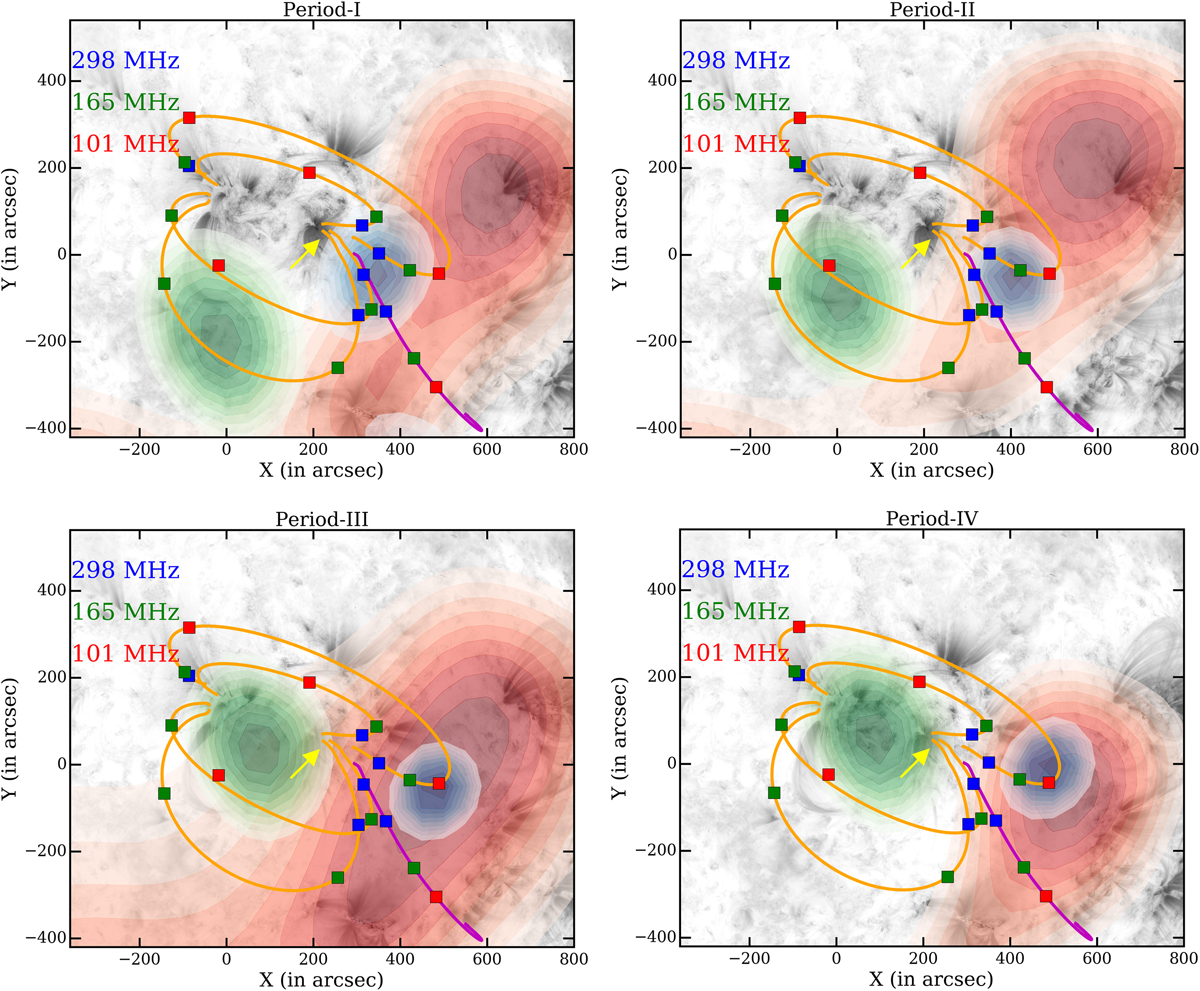
AIA 171 Å image at 03:51:47 UT and red, green, and blue overplotted contours (50, 55, 60, 65, 70, 75, 80, 85, 90, and 95% of peak of flux) represent 101, 165, and 298 MHz radio frequencies, respectively. The yellow arrow indicates the location of the jet eruption. Orange and magenta lines indicate closed and open field lines, respectively, which are derived from the extrapolation. The red, green, and blue colored squares show the locations along extrapolated magnetic loops where the local fundamental plasma frequency is expected to be 101, 165, and 298 MHz (see text), respectively.
Current usage metrics show cumulative count of Article Views (full-text article views including HTML views, PDF and ePub downloads, according to the available data) and Abstracts Views on Vision4Press platform.
Data correspond to usage on the plateform after 2015. The current usage metrics is available 48-96 hours after online publication and is updated daily on week days.
Initial download of the metrics may take a while.