Fig. 7.
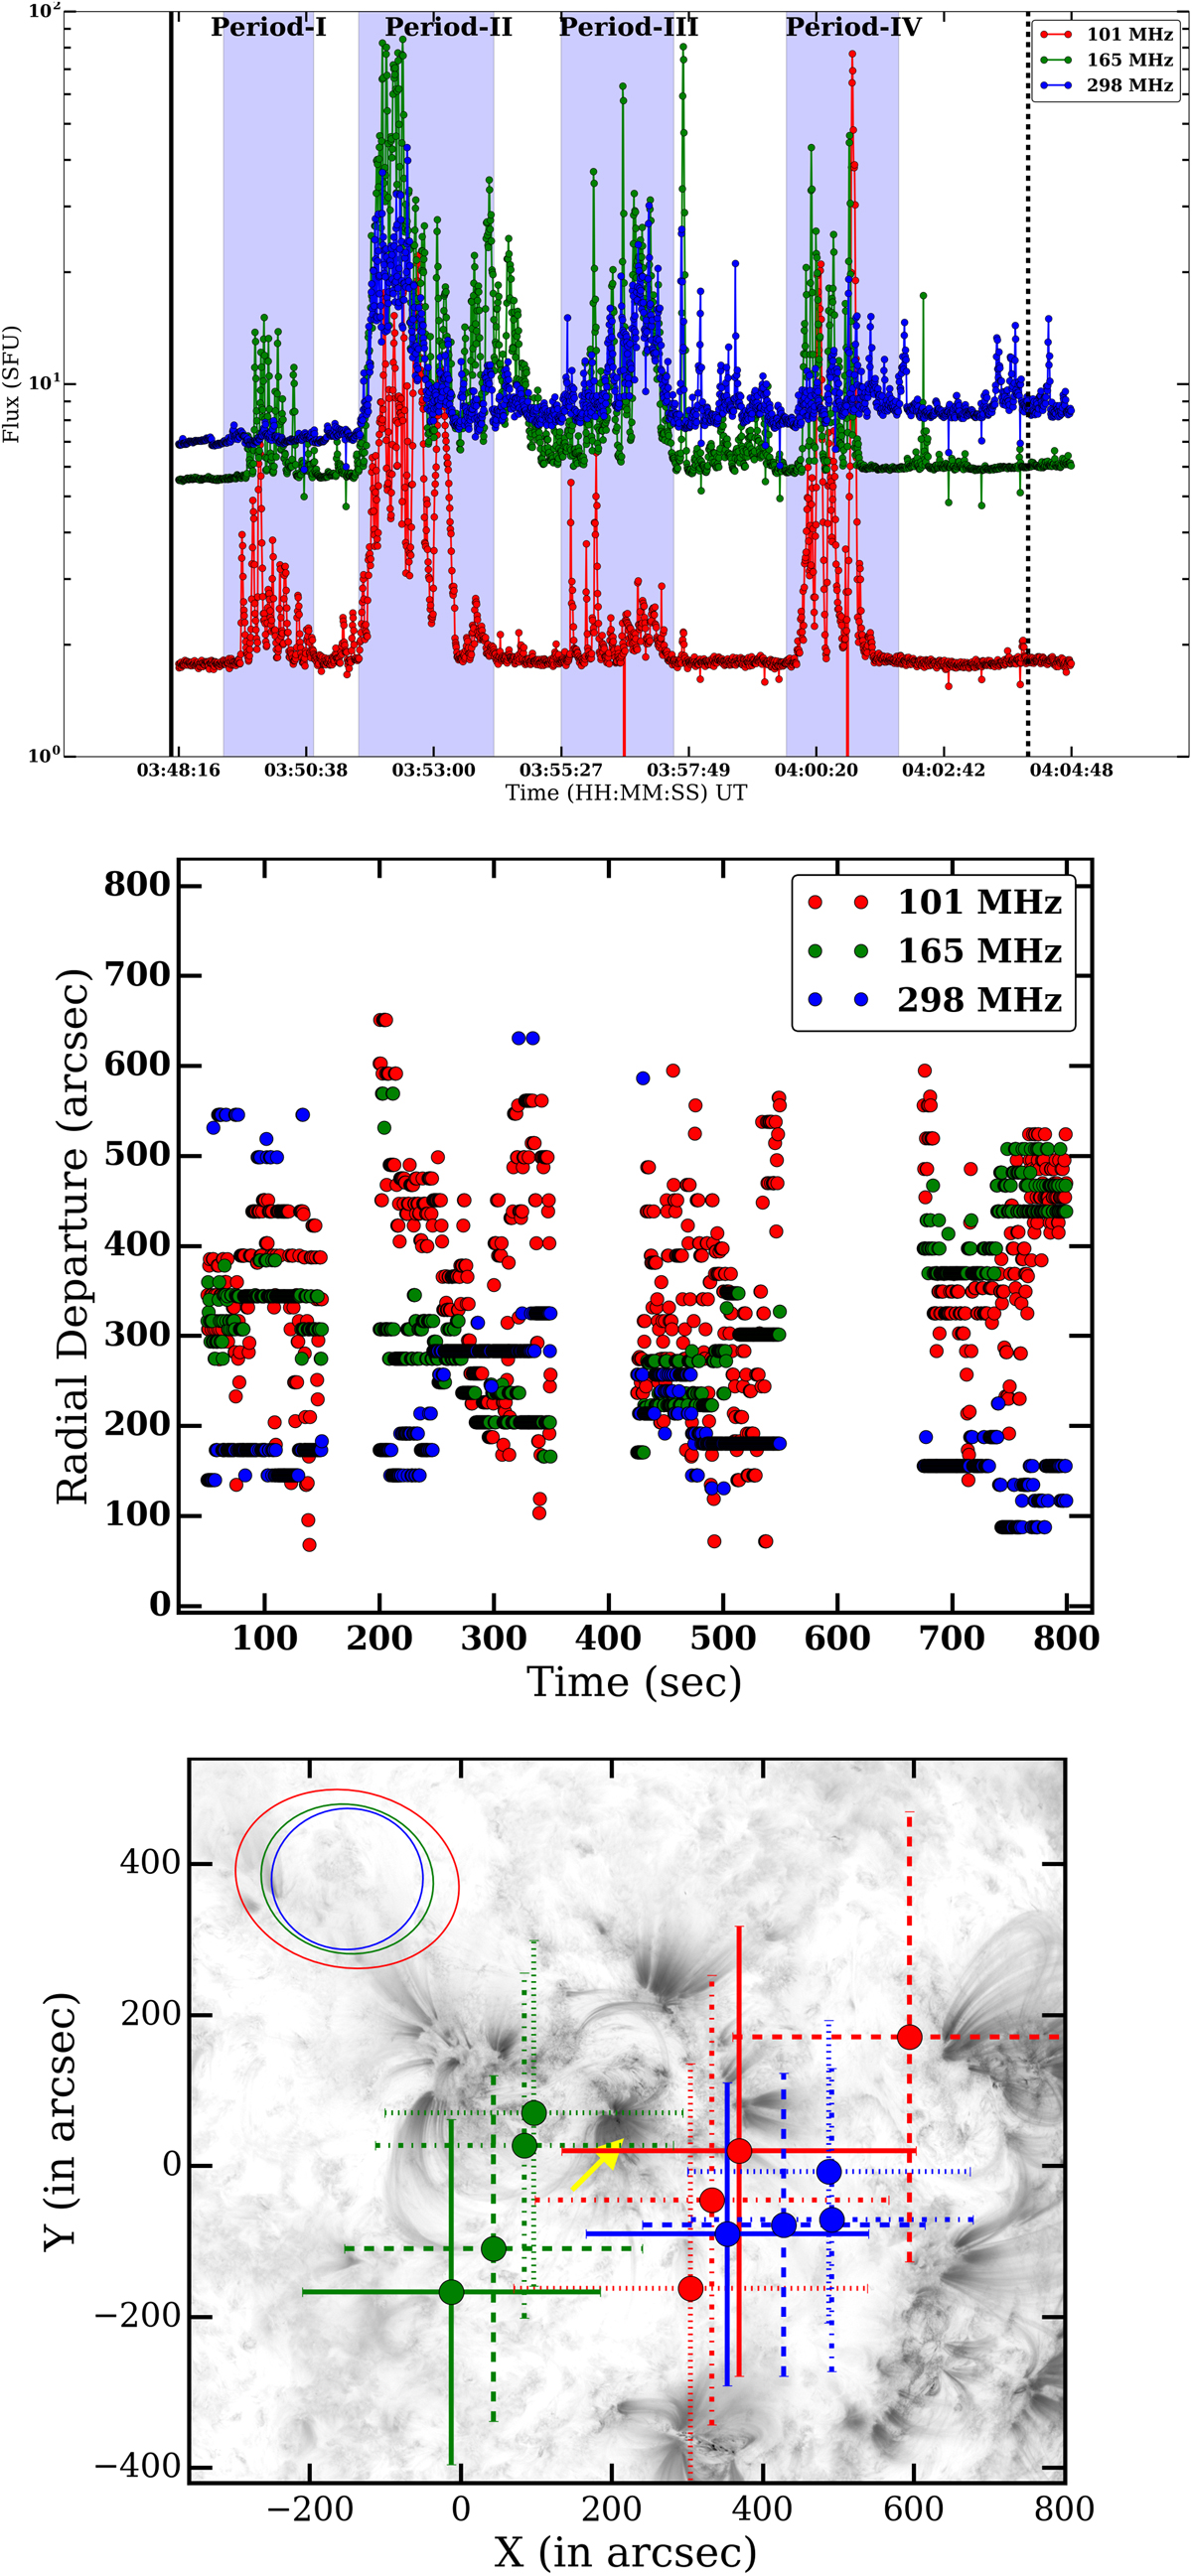
Top panel: temporal evolution of radio fluxes obtained from MWA spectrum for three selected bands. The solid and dashed vertical black lines indicate the start and end times of the jet event respectively. The purple shaded vertical bands indicate the periods of the four dominant radio bursts. Middle panel: distance (in arcsecs) between location of jet and centroid of radio source for each of four bursts. Bottom panel: location of radio sources with respect to jet position for different periods and frequencies. The blue, green, and red colors correspond to 298, 165, and 101 MHz respectively. The line styles solid (-), dashed (–), dashed-dotted (-.) and dotted (..) represent periods I–IV, respectively. The ellipses shown on the top-left are the beam sizes at 101 (red), 165 (green), and 298 (blue) MHz.
Current usage metrics show cumulative count of Article Views (full-text article views including HTML views, PDF and ePub downloads, according to the available data) and Abstracts Views on Vision4Press platform.
Data correspond to usage on the plateform after 2015. The current usage metrics is available 48-96 hours after online publication and is updated daily on week days.
Initial download of the metrics may take a while.