Free Access
Fig. 6.
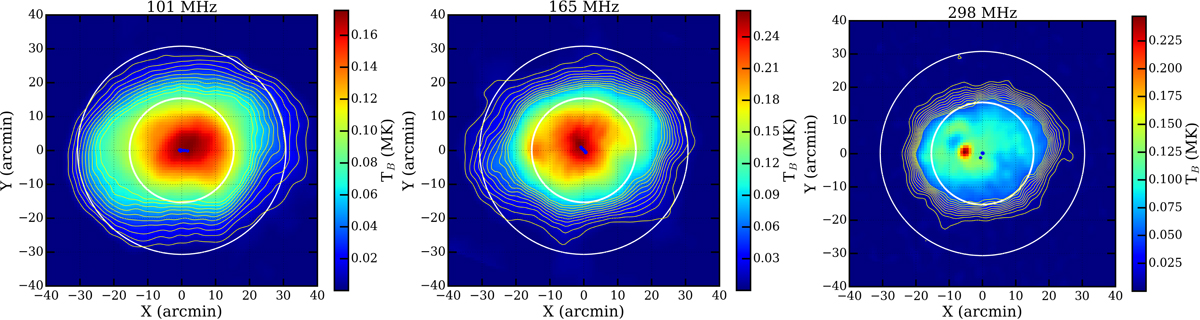
Solar disk images at 101, 165, and 298 MHz represent thermal emission at 03:48 UT. The yellow contours show thermal emission plotted as 0.4–4.0% of the peak flux at that frequency. The two white circles shown in each panel have radii 1 R⊙ and 2 R⊙, the smaller one represents the limb of the optical solar disk.
Current usage metrics show cumulative count of Article Views (full-text article views including HTML views, PDF and ePub downloads, according to the available data) and Abstracts Views on Vision4Press platform.
Data correspond to usage on the plateform after 2015. The current usage metrics is available 48-96 hours after online publication and is updated daily on week days.
Initial download of the metrics may take a while.