Fig. 4.
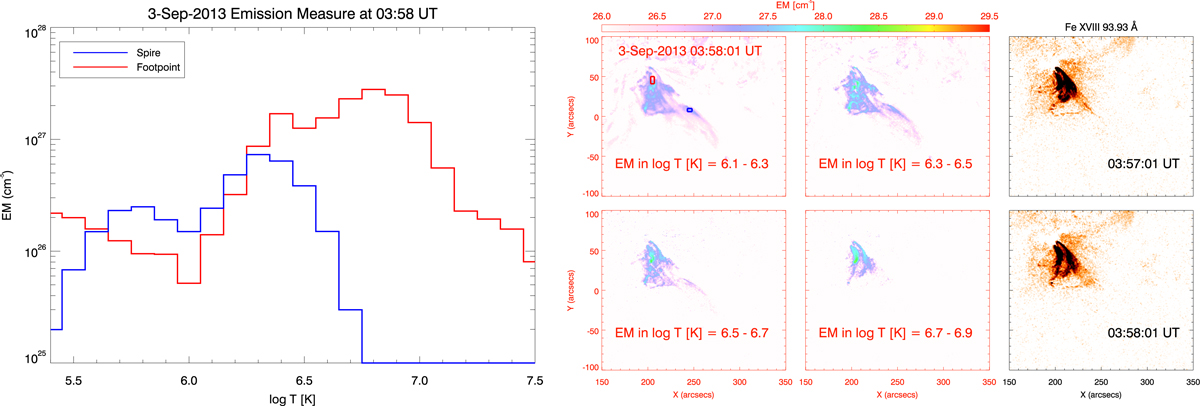
Left panel: emission measure curves for spire (blue) and footpoint (red) of jet. Right panel: emission measure maps obtained for various temperature intervals (Cols. 1 and 2) and Fe XVIII 93.93 Å (Col. 3, reverse color images) emission estimated from the AIA 94 Å channel (see online Movie 1). The small blue and red boxes show the spire and footpoint regions, respectively, where the EM curves were created.
Current usage metrics show cumulative count of Article Views (full-text article views including HTML views, PDF and ePub downloads, according to the available data) and Abstracts Views on Vision4Press platform.
Data correspond to usage on the plateform after 2015. The current usage metrics is available 48-96 hours after online publication and is updated daily on week days.
Initial download of the metrics may take a while.