Fig. 3.
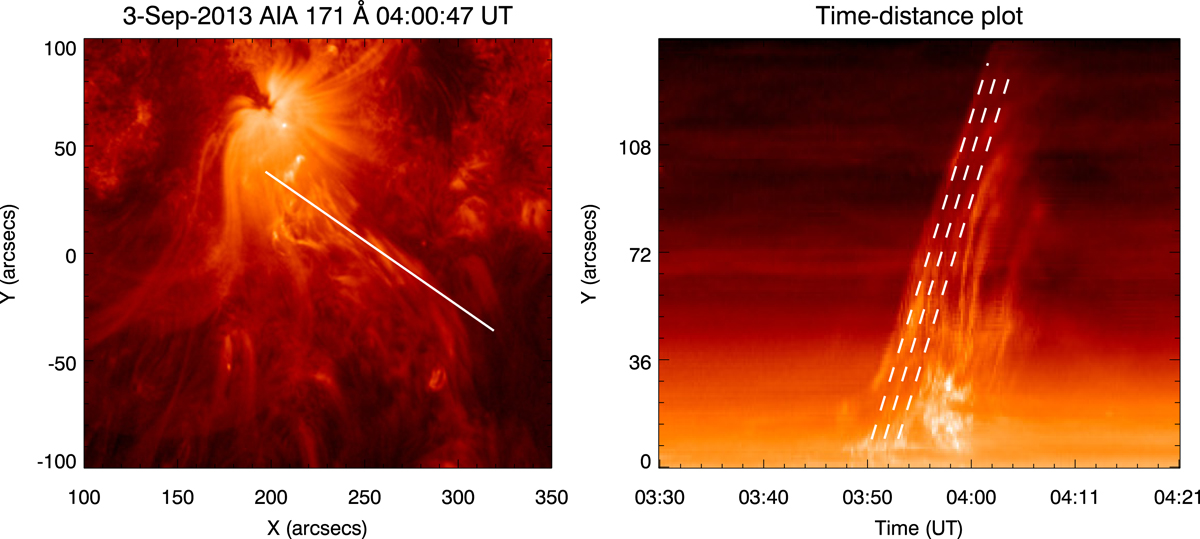
Left panel: AIA 171 Å image of jet at 04:00:47 UT. The white overplotted line represents an artificial slit which was used to create a time-distance plot (the variation in the intensities along the artificial slit are shown as a function of time). Right panel: time-distance plot for jet. The white dashed lines along the jet-spire structure are used for the plane-of-sky velocity calculation. The velocity was found to be ∼136 km s−1.
Current usage metrics show cumulative count of Article Views (full-text article views including HTML views, PDF and ePub downloads, according to the available data) and Abstracts Views on Vision4Press platform.
Data correspond to usage on the plateform after 2015. The current usage metrics is available 48-96 hours after online publication and is updated daily on week days.
Initial download of the metrics may take a while.