Fig. 10.
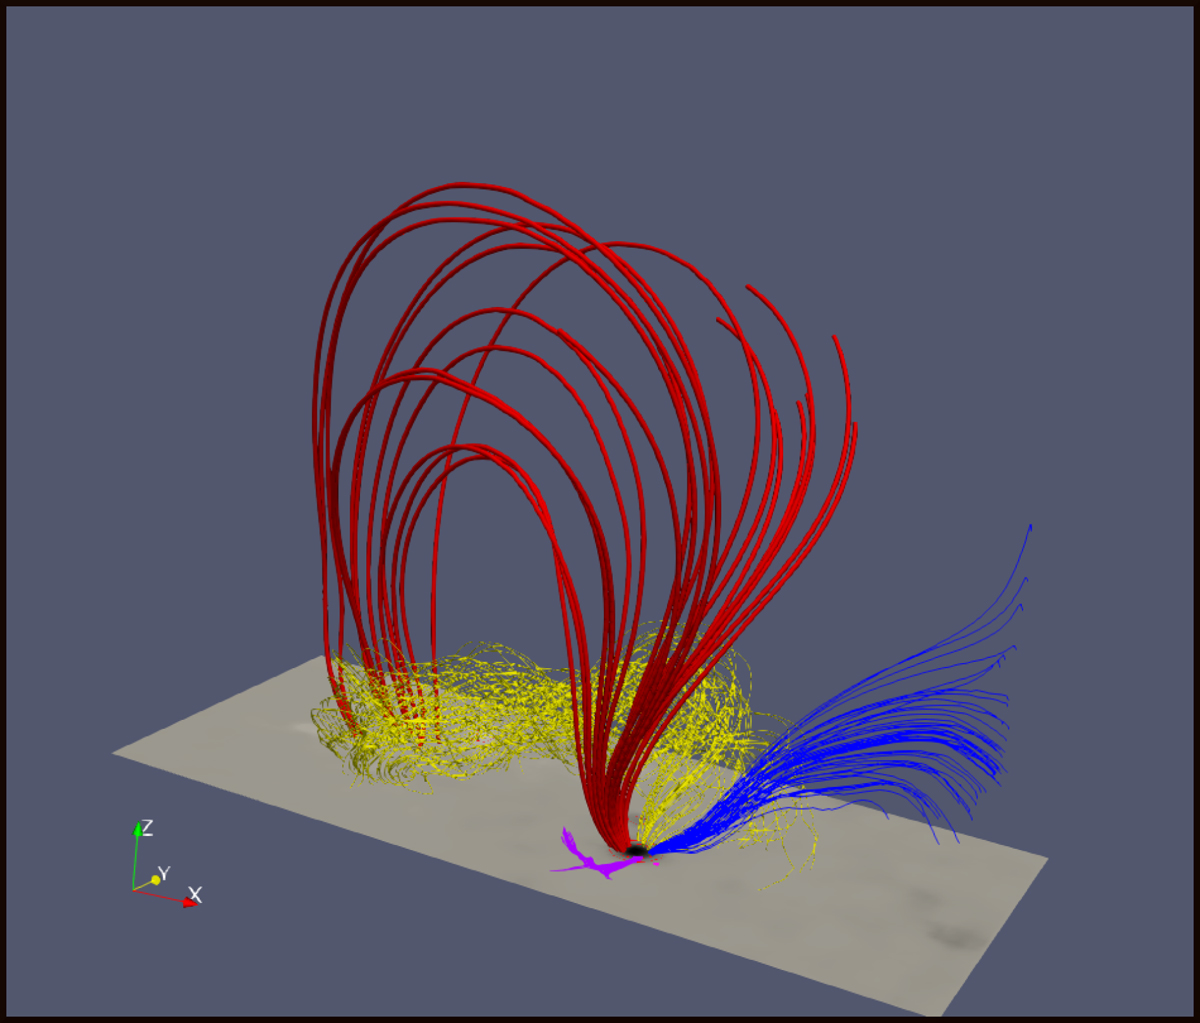
Global configuration of active region was obtained by using a NLFFF extrapolation. The red field lines represent a wide envelope of the active region, yellow lines represent flux rope structure, blue lines represent the open field lines, and pink field lines represent the source region of the jet. The active region patch of the vector magnetic field from the HMI SHARP series is shown in a gray color and the black dot represents the negative polarity sunspot.
Current usage metrics show cumulative count of Article Views (full-text article views including HTML views, PDF and ePub downloads, according to the available data) and Abstracts Views on Vision4Press platform.
Data correspond to usage on the plateform after 2015. The current usage metrics is available 48-96 hours after online publication and is updated daily on week days.
Initial download of the metrics may take a while.