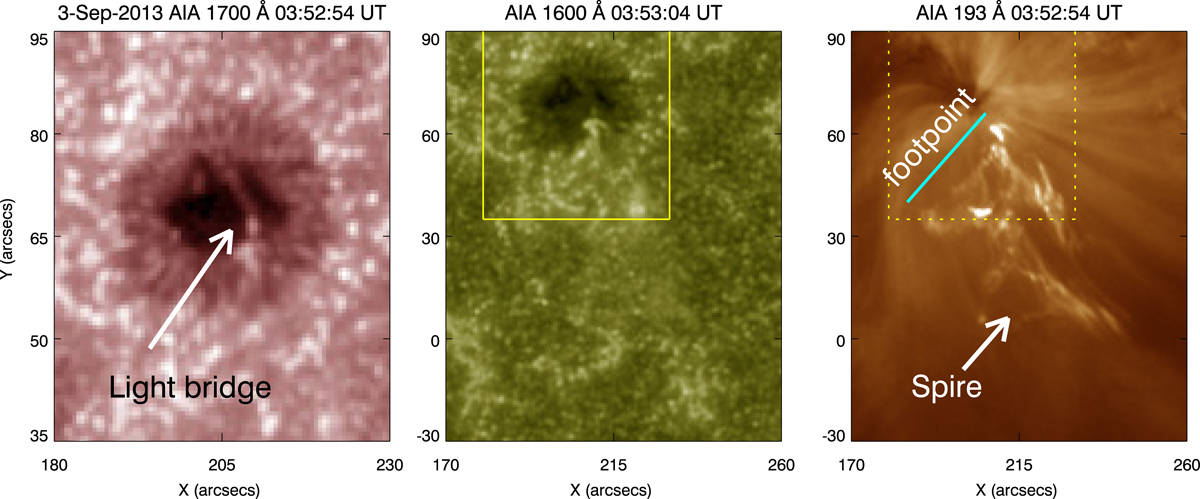
Fig. 1.

AIA images of a jet and a sunspot. Left panel: AIA 1700 Å image of sunspot associated to active region NOAA 11836 (N11 W10). The light bridge is indicated by a white arrow. Middle and right panel: AIA 1600 and 193 Å images during jet activity. The field-of-view shown in the left panel is denoted by a solid-line and dashed-line box in the middle and right panels, respectively. The extent of the footpoint region is shown by a cyan line and the spire region is shown by a white arrow.
Current usage metrics show cumulative count of Article Views (full-text article views including HTML views, PDF and ePub downloads, according to the available data) and Abstracts Views on Vision4Press platform.
Data correspond to usage on the plateform after 2015. The current usage metrics is available 48-96 hours after online publication and is updated daily on week days.
Initial download of the metrics may take a while.


