Open Access
Fig. 10.
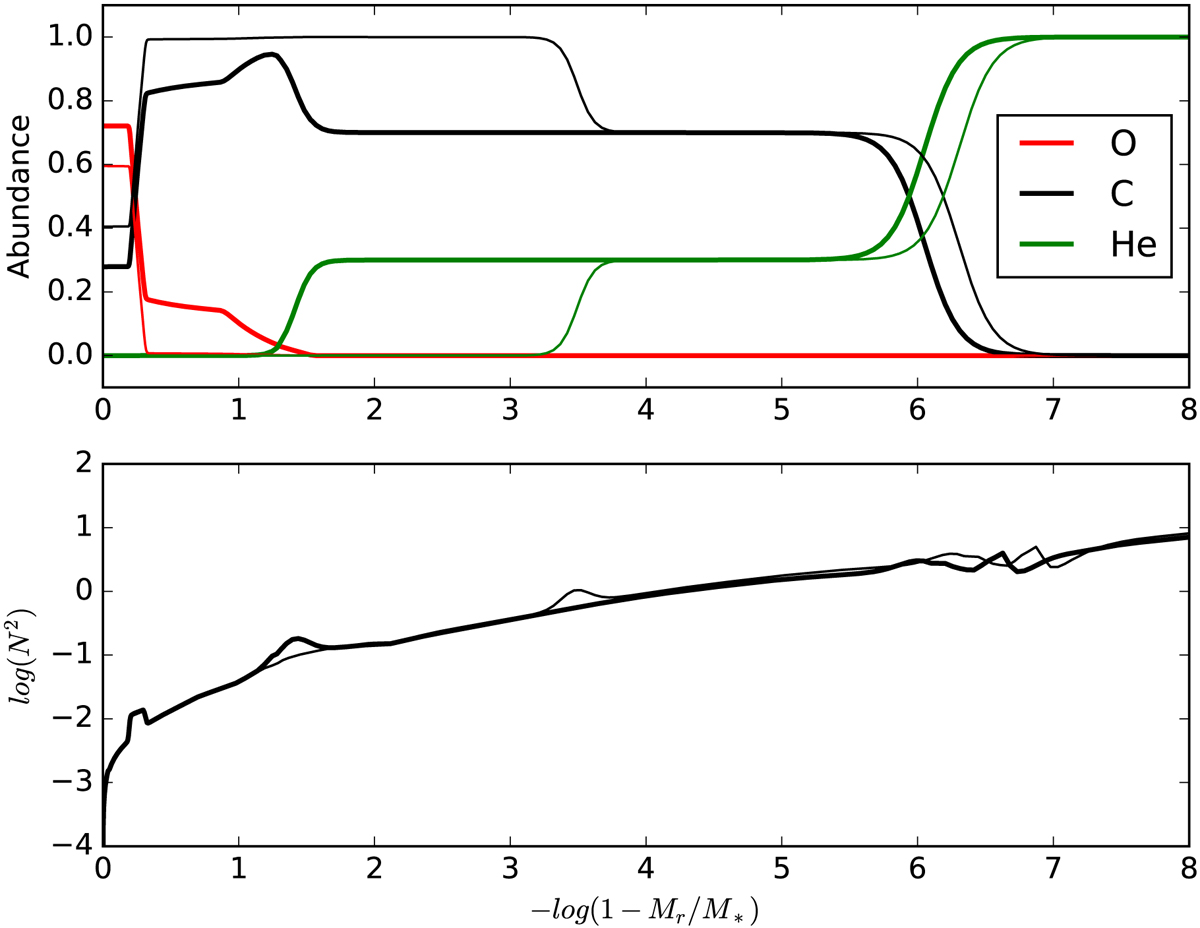
Top panel: chemical abundance profiles for the two best fit models of Table 3 (fits 1 and 3 with higher effective temperatures). The bold lines correspond to fit 1, while the thin lines correspond to fit 3. Bottom panel: corresponding Brunt–Väiäsalä frequency curves.
Current usage metrics show cumulative count of Article Views (full-text article views including HTML views, PDF and ePub downloads, according to the available data) and Abstracts Views on Vision4Press platform.
Data correspond to usage on the plateform after 2015. The current usage metrics is available 48-96 hours after online publication and is updated daily on week days.
Initial download of the metrics may take a while.