Fig. 7
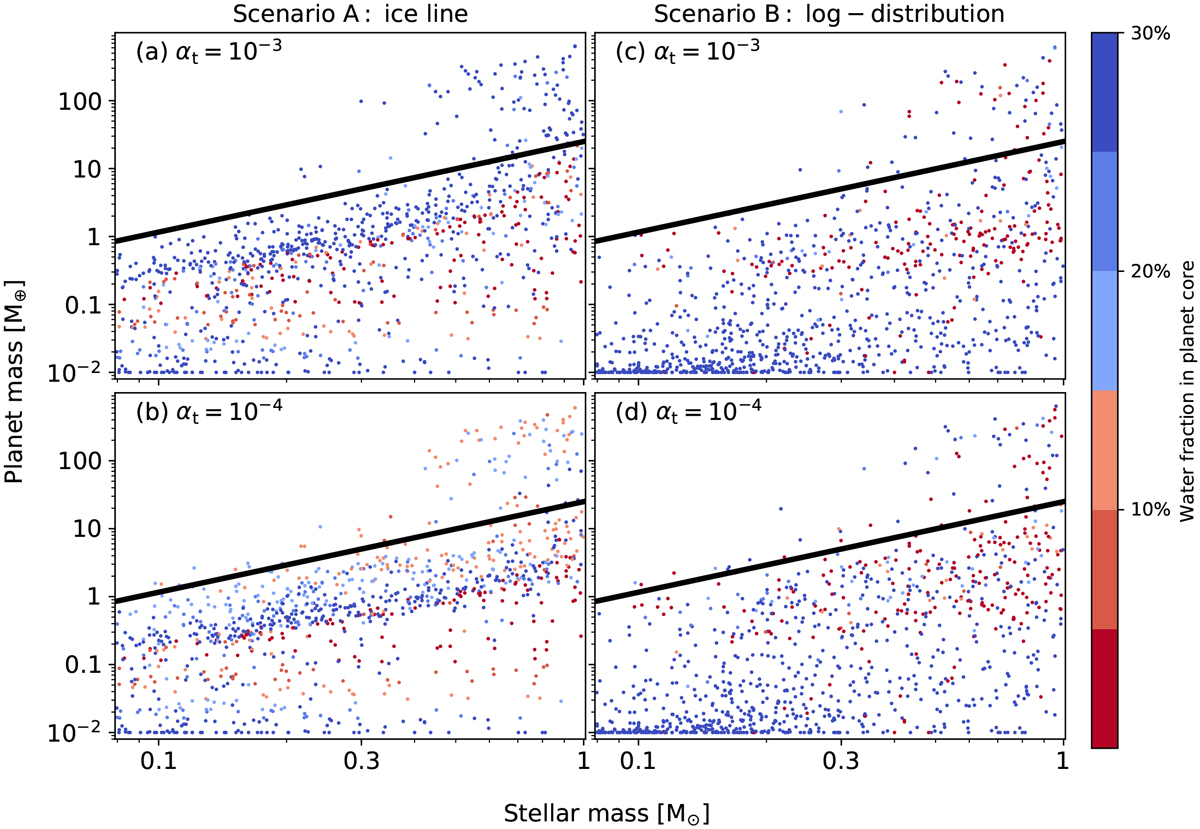
Monte Carlo sampling plot of the planet mass vs. the stellar mass, with the ice line planet formation model (scenario A) in the left, the log-uniform distributed planet formation model (scenario B) in the right, αt = 10−3 in the top and αt = 10−4 in the bottom. The color corresponds to the water mass fraction in the planetary core. The black line represents the characteristic mass of the simulated super-Earths, set by the pebble isolation mass from Eq. (39). The Mp − M⋆ scaling is almost insensitive to the explored disk turbulent αt values and embryos’ birth locations r0. The planet with moderate water fraction can form from the water ice line in less turbulent disks. Planets formed over a wide range of disk distances end up with a distinctive, bimodal water mass distribution.
Current usage metrics show cumulative count of Article Views (full-text article views including HTML views, PDF and ePub downloads, according to the available data) and Abstracts Views on Vision4Press platform.
Data correspond to usage on the plateform after 2015. The current usage metrics is available 48-96 hours after online publication and is updated daily on week days.
Initial download of the metrics may take a while.