Fig. 6
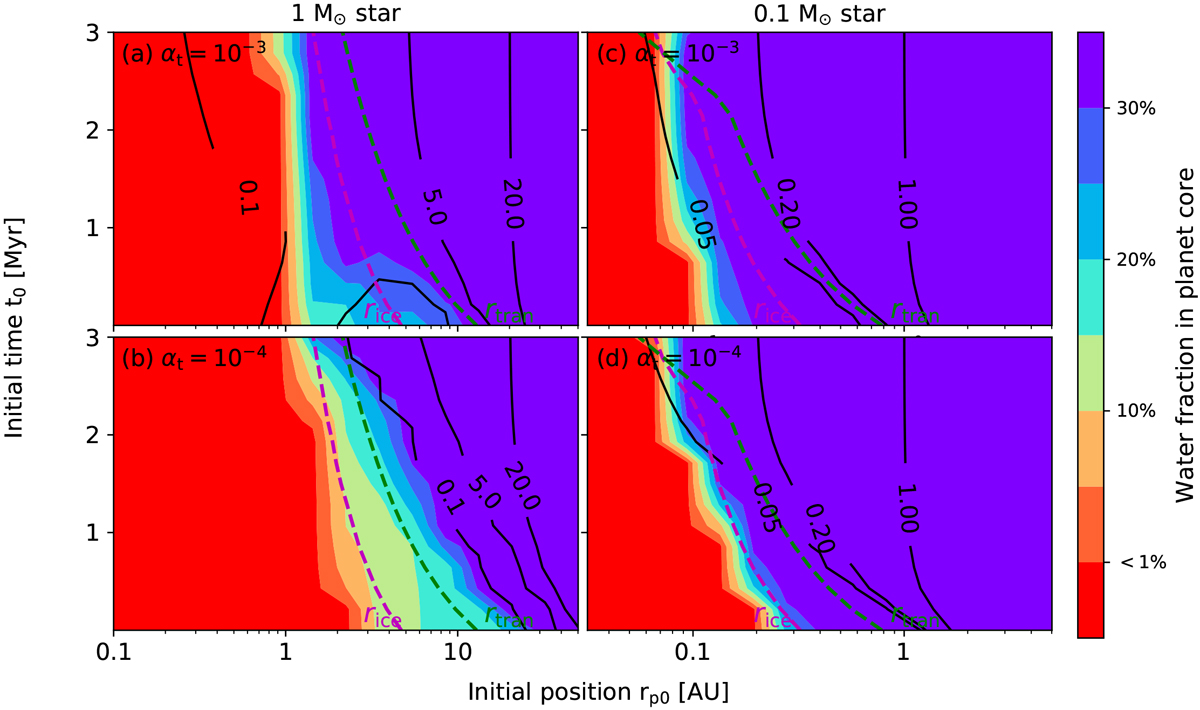
Maps for the core water mass fraction of planets around stars of 1 M⊙ (left) and 0.1 M⊙ (right) and at disk turbulent αt = 10−3 (top) and 10−4 (bottom). The initial time t0 and initial location r0 are shown in x and y axis. The color corresponds to the water fraction, and the black line represents the final location of the planet. The water ice line and the transition radius are labeled as magenta and cyan dashed lines. The parameters are adopted from run_D3 for the left panel and run_M3 for the right panel, respectively. The final water of the planets depends on the birth locations of the protoplanetary seeds. When forming at the water ice line, these planets would end up with a few percent to a few tens of percents water in mass.
Current usage metrics show cumulative count of Article Views (full-text article views including HTML views, PDF and ePub downloads, according to the available data) and Abstracts Views on Vision4Press platform.
Data correspond to usage on the plateform after 2015. The current usage metrics is available 48-96 hours after online publication and is updated daily on week days.
Initial download of the metrics may take a while.