Fig. 5
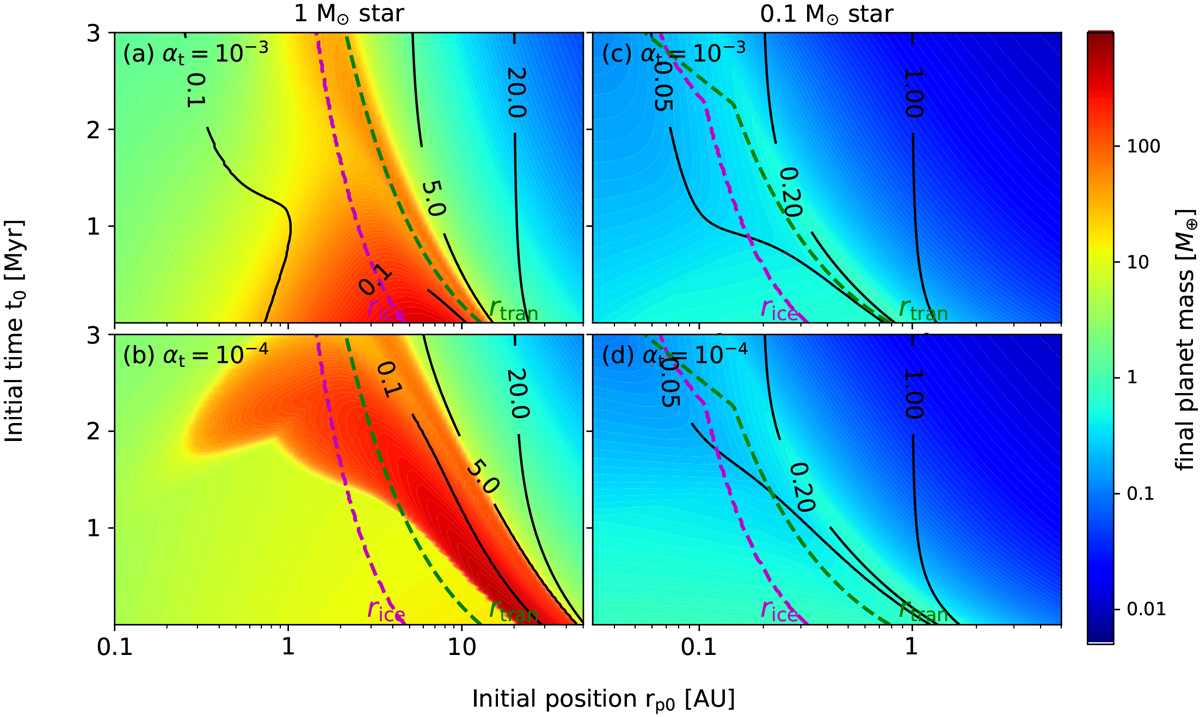
Maps for the growth and migration of planets around stars of 1 M⊙ (left) and 0.1 M⊙ (right) and at disk turbulent αt = 10−3 (top) and 10−4 (bottom). The initial time t0 and initial location r0 are shownin x and y axis. The color corresponds to the final mass of the planet, and the black line represents the final location of the planet. The water ice line and the transition radius are labeled as magenta and cyan dashed lines. The parameters are adopted from run_D3 for the left panel and run_M3 for the right panel, respectively. We would like to note that the disk lifetimes in above two cases are longer than 3 Myr. Jupiter-mass planets can form around a 1 M⊙ star while Earth-mass planets can form around a 0.1 M⊙ star.
Current usage metrics show cumulative count of Article Views (full-text article views including HTML views, PDF and ePub downloads, according to the available data) and Abstracts Views on Vision4Press platform.
Data correspond to usage on the plateform after 2015. The current usage metrics is available 48-96 hours after online publication and is updated daily on week days.
Initial download of the metrics may take a while.