Fig. 4
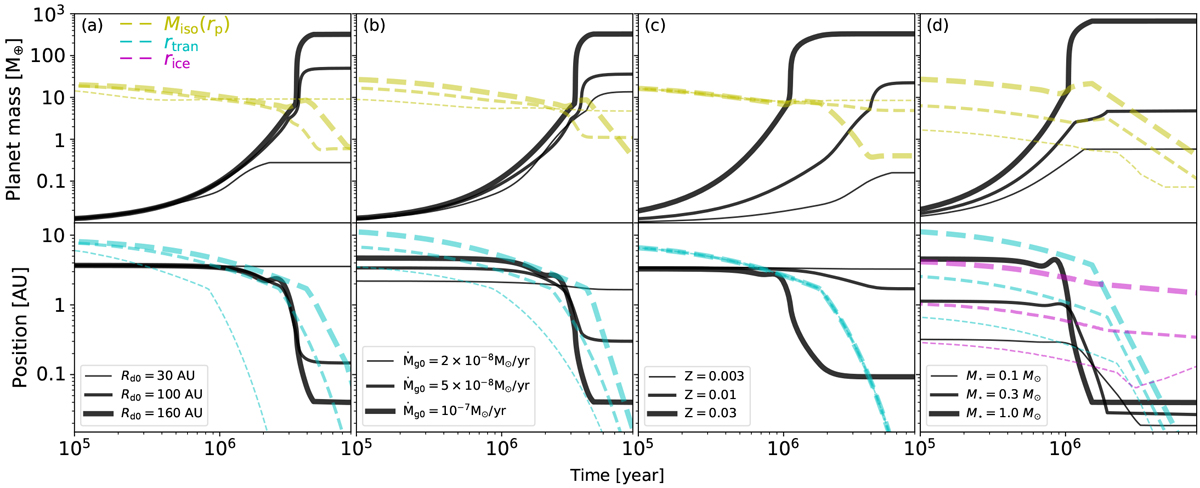
Planet mass growth (top) and orbital evolution (bottom) with different initial disk sizes (panel a, run_R1 to run_R3), initial disk accretion rates (panel b, run_D1 to run_D3), disk metallicities (panel c, run_Z1 to run_Z3) and masses of central stars(panel d, run_M1 to run_M3). The yellow dashed lines represent the pebble isolation masses at the planets’ locations, whereas the cyan and the magenta dashed lines correspond to the transition radii between two disk regions and the water ice lines (only shown in panel d). Massive planets are likely to form when the disk sizes are larger, the disk accretion rates are higher, the disks are more metal rich, and their stellar hosts are more massive.
Current usage metrics show cumulative count of Article Views (full-text article views including HTML views, PDF and ePub downloads, according to the available data) and Abstracts Views on Vision4Press platform.
Data correspond to usage on the plateform after 2015. The current usage metrics is available 48-96 hours after online publication and is updated daily on week days.
Initial download of the metrics may take a while.