Fig. 3
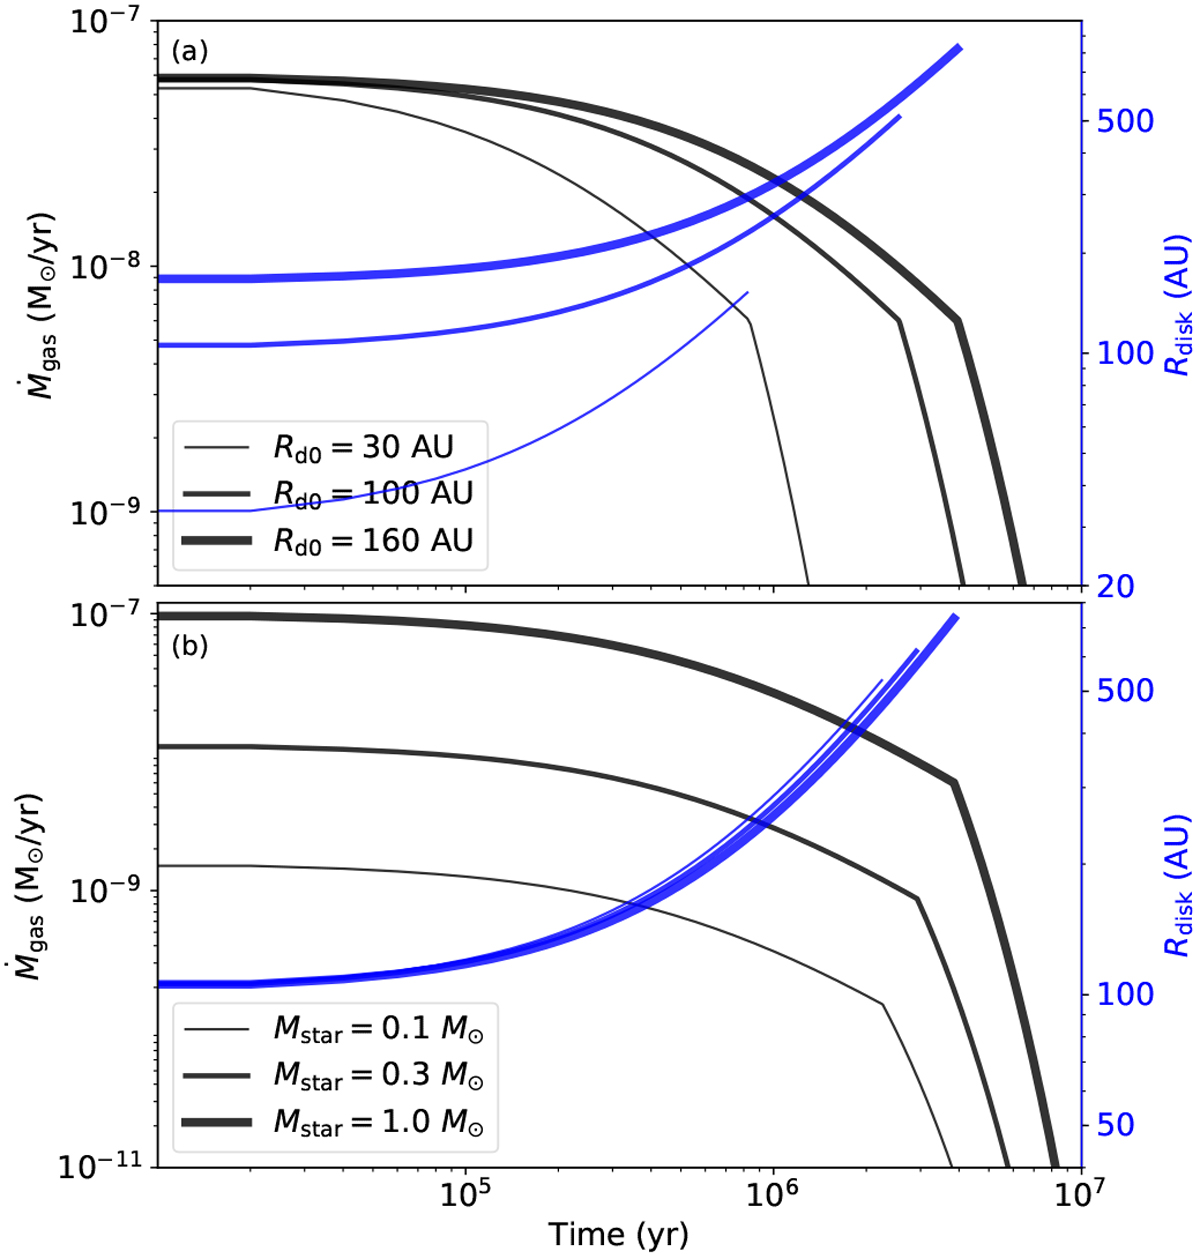
Evolution of disk accretion rate (black) and characteristic disk size (blue). When Ṁg < Ṁpho (Eq. (6)), the disk angular momentum is transported by viscous accretion; later the gas removal is driven by stellar X-ray evaporation. The expansion of the disk sizes are shown insolid lines due to viscous spreading. Top: three systems with different initial disk sizes (Rd0 = 30 AU, 100 AU and 160 AU) are shown around a 1 M⊙ star. The initial disk accretion rates are all 6 × 10⁻⁸ M⊙ yr−1. Bottom: three systems with the same initial disk size (Rd0 = 100 AU) are shown around different masses of stars (M⋆ = 1 M⊙, 0.3 M⊙ and 0.1 M⊙). The initial disk accretion rates follow ![]() . We would like to note that the two panels share the same x-axis.
. We would like to note that the two panels share the same x-axis.
Current usage metrics show cumulative count of Article Views (full-text article views including HTML views, PDF and ePub downloads, according to the available data) and Abstracts Views on Vision4Press platform.
Data correspond to usage on the plateform after 2015. The current usage metrics is available 48-96 hours after online publication and is updated daily on week days.
Initial download of the metrics may take a while.