Fig. 8
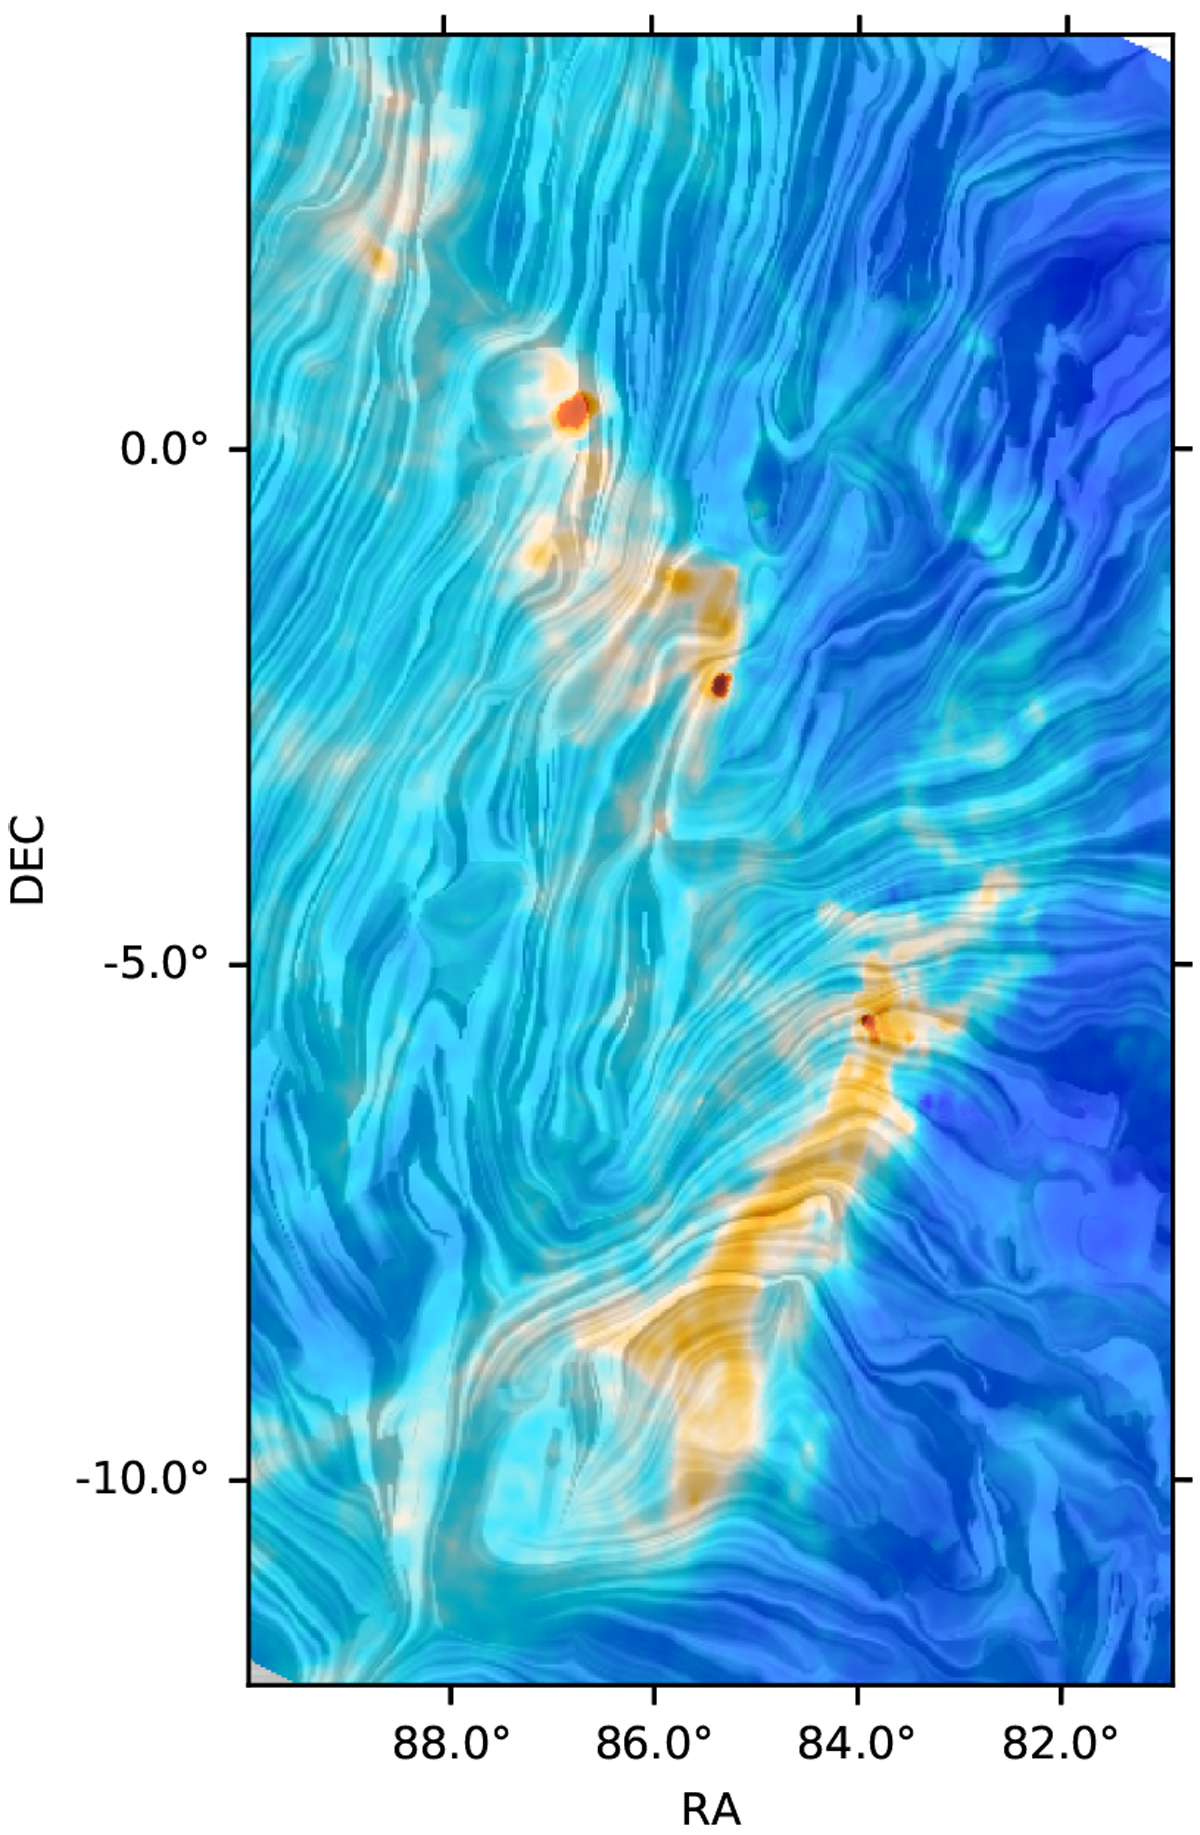
Column density and magnetic field toward Orion region. The colors correspond to the dust opacity derived from the Planck observations. The drapery pattern corresponds to the orientation of the magnetic field projected on the plane of the sky and integrated along the line of sight, as inferred from the Planck 353-GHz observations. The yellow color between a declination of about − 5° and − 10° shows the Orion-A filamentary structure as illustrated in Fig. 2. The B⊥ lines on one side of this filament are mostly perpendicular to the filament (representing a small pitch angle for a helical morphology). While, on the other side, they are more parallel to the filament.
Current usage metrics show cumulative count of Article Views (full-text article views including HTML views, PDF and ePub downloads, according to the available data) and Abstracts Views on Vision4Press platform.
Data correspond to usage on the plateform after 2015. The current usage metrics is available 48-96 hours after online publication and is updated daily on week days.
Initial download of the metrics may take a while.