Fig. 5
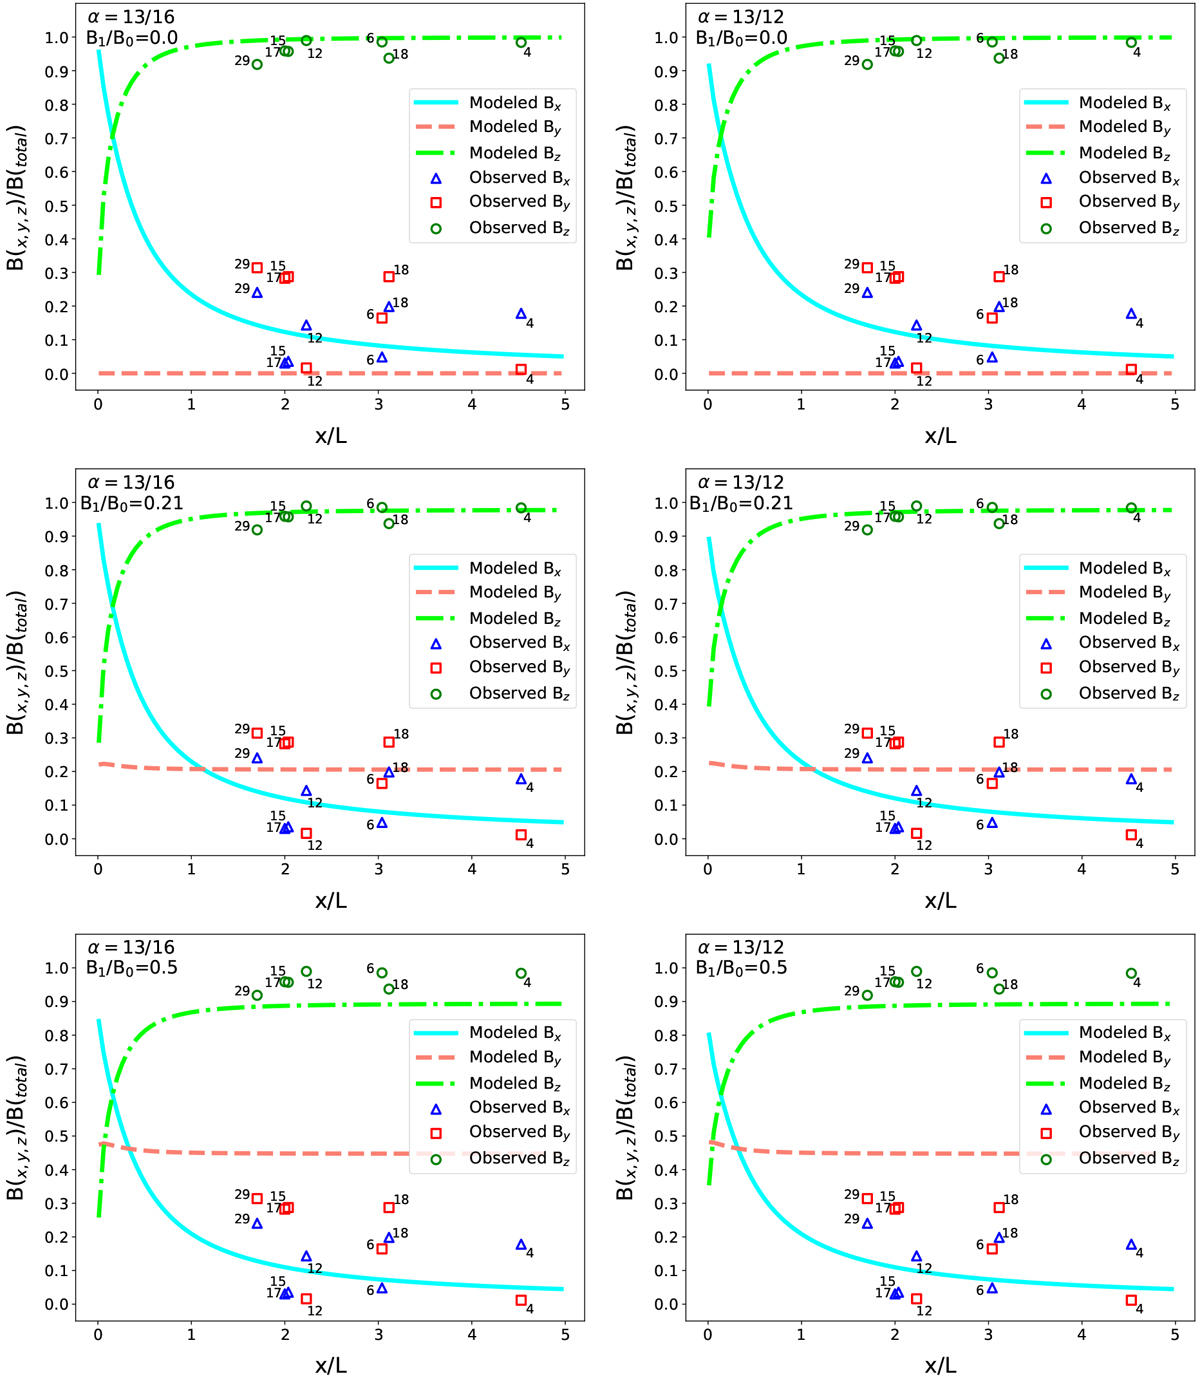
Best fits for modeled toroidal and helical fields. Colored lines represent the modeled x, y, and z components of the magnetic field. The colored symbols represent the x, y, and z components of the observed magnetic field. On x-axis, X isthe perpendicular distance from the filament’s long axis, and L is the LOS integration distance. The two α values are the parameters explained in Sect. 3.2. The different B1 /B0 ratios arise from Eq. (2) and set the level of helicity, with B1/B0 = 0 indicating a purely toroidal field.
Current usage metrics show cumulative count of Article Views (full-text article views including HTML views, PDF and ePub downloads, according to the available data) and Abstracts Views on Vision4Press platform.
Data correspond to usage on the plateform after 2015. The current usage metrics is available 48-96 hours after online publication and is updated daily on week days.
Initial download of the metrics may take a while.