Fig. 12.
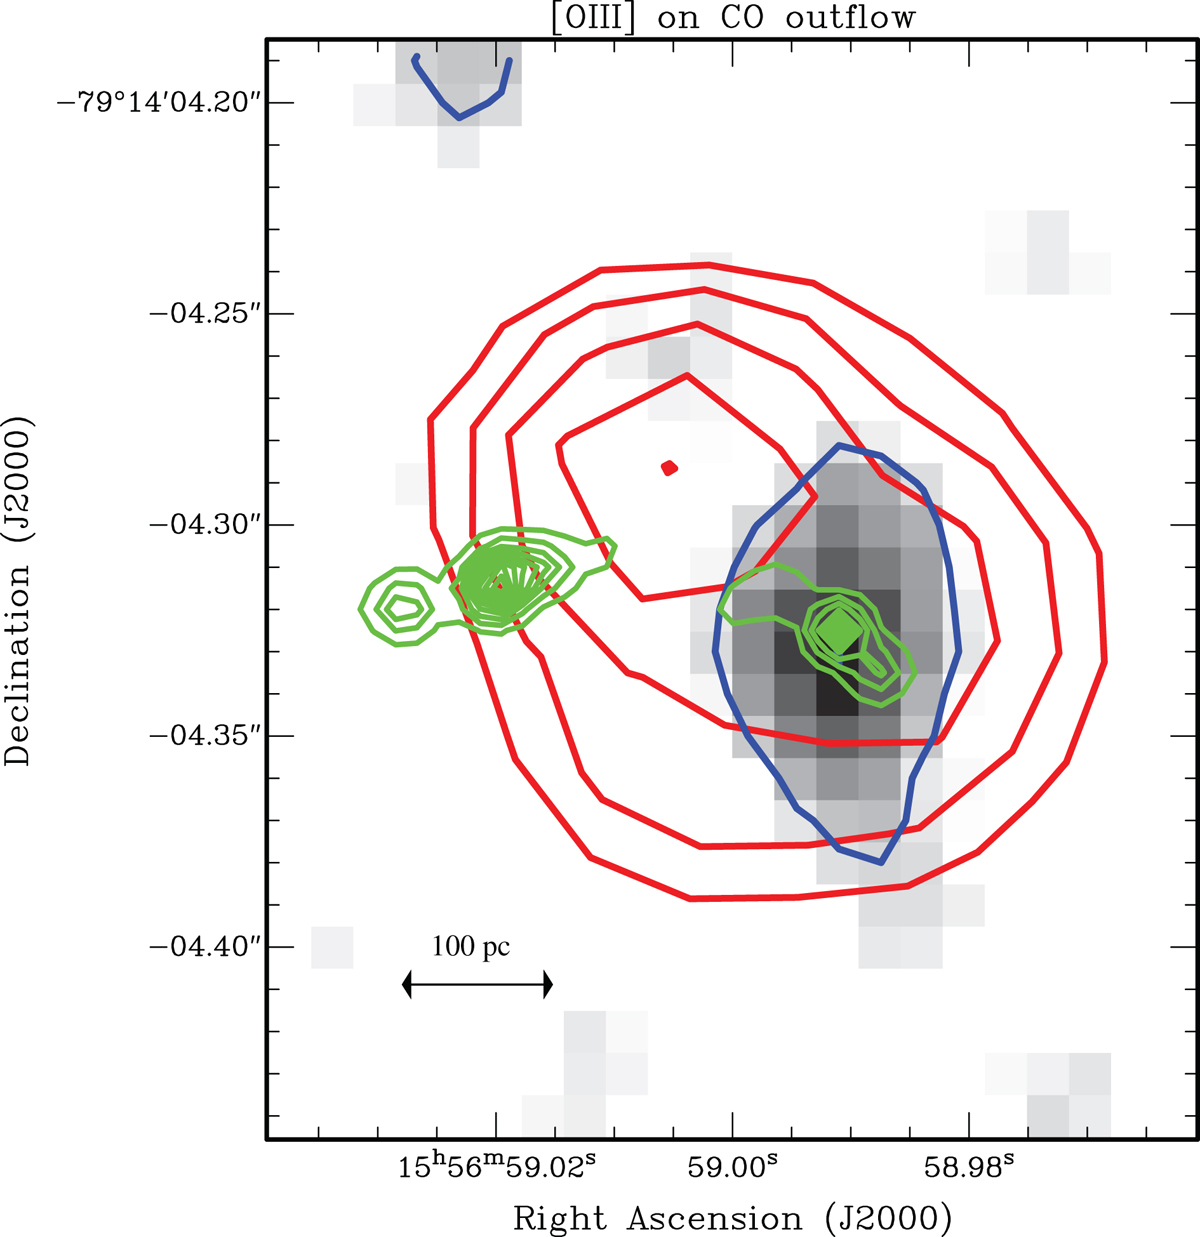
Relative extent of the [O II] emission (HST data from Batcheldor et al. 2007; red contours) compared to the super-resolved 100-GHz radio continuum (green contours) and the region of the broad CO(1−0) profile (blue contours). The CO(1−0) distribution was obtained by integrating the CO(1−0) data cube over the velocity range –300 km s−1 to –2000 km s−1. Contour levels for the HST data are 0.25, 35.4, 50, 70.7 and 100% of the peak emission while for the CO(1−0) they are 50 and 100% of the peak.
Current usage metrics show cumulative count of Article Views (full-text article views including HTML views, PDF and ePub downloads, according to the available data) and Abstracts Views on Vision4Press platform.
Data correspond to usage on the plateform after 2015. The current usage metrics is available 48-96 hours after online publication and is updated daily on week days.
Initial download of the metrics may take a while.