Fig. 7.
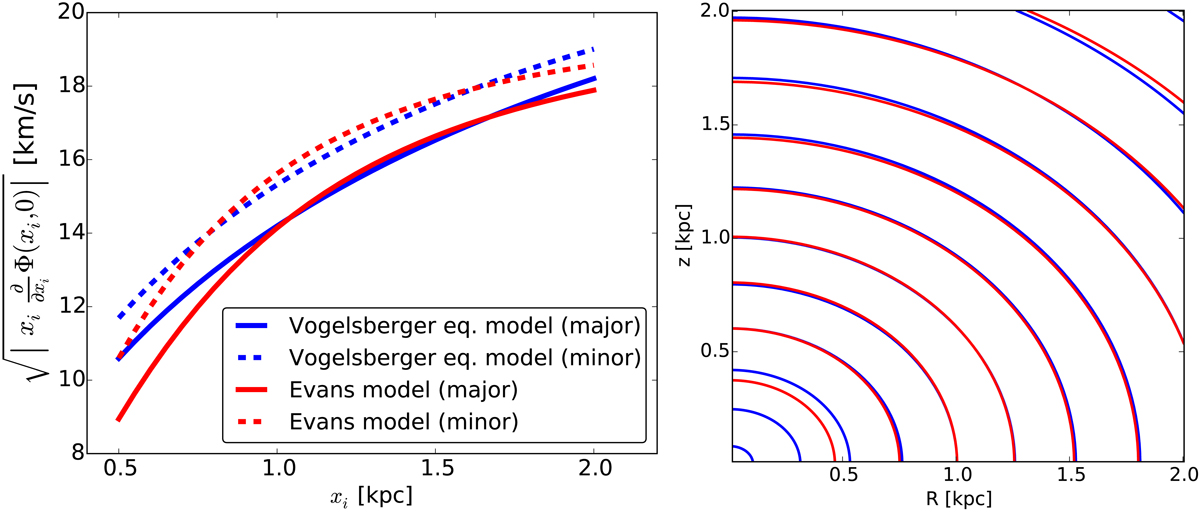
Left: major (full lines) and minor (dashed lines) axis gradients of the potential as functions of R and z, respectively, for the true Evans model (red) and for the matched Vogelsberger model with c/a ≃ 0.776, Rs ≃ 4.9 kpc and log10(M1 kpc[M⊙]) ≃ 7.69 (blue). Right: comparison of the isopotential contours for the true Evans model (red) and the matched Vogelsberger model (blue). For the purpose of this figure the zero-point of the potential is chosen here such that ΦE = ΦV at (R, z) = (1, 0) kpc. For each potential, contours are drawn at the positions where Φ has changed in steps of 50 km2 s−2. In the region from 0.7 up to 2 kpc the matched Vogelsberger model follows well the true Evans potential. For more inner radii the (cusped) Vogelsberger models cannot reproduce the (less steep) cored behaviour of the Evans potential.
Current usage metrics show cumulative count of Article Views (full-text article views including HTML views, PDF and ePub downloads, according to the available data) and Abstracts Views on Vision4Press platform.
Data correspond to usage on the plateform after 2015. The current usage metrics is available 48-96 hours after online publication and is updated daily on week days.
Initial download of the metrics may take a while.