Fig. 6.
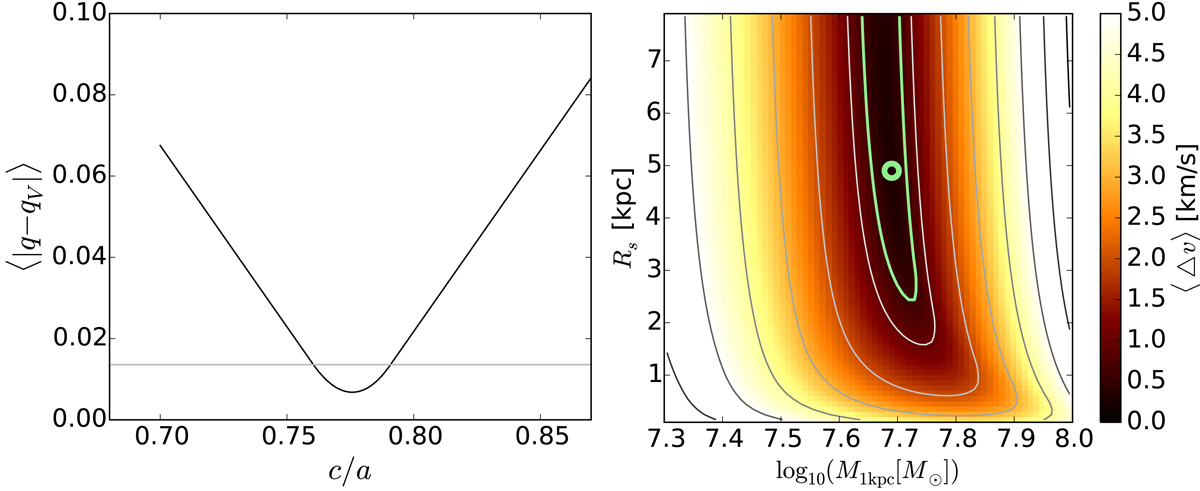
Estimating the “true” parameters of the Vogelsberger system by comparing the differences in potential flattening on the left and the differences in the gradients of the potentials on the right. The comparisons are based on the distance interval from 0.5 up to 2.0 kpc (with steps of 0.05 kpc) from the centre of the galaxy. Left: mean absolute difference of the Vogelsberger potential flattening and the true potential flattening of the mock galaxy as a function of the flattening parameter c/a of the Vogelsberger potential (black line). The grey horizontal line marks the positions where this difference has doubled with respect to the minimum 0.007 at c/a ≃ 0.776. Right: minimisation of the mean of the absolute differences in the gradients of the potential along the major and minor axis (compared to the mock galaxy) by varying the Vogelsberger model parameters M1 kpc and Rs. The figure is obtained after setting the flattening parameter to c/a = 0.776. The colour bar is truncated at 5.0 km s−1. The green circle indicates the location at log10(M1 kpc[M⊙]) ≃ 7.69 and Rs = 4.9 kpc where the differences are minimum (⟨ △ v⟩min = 0.31 km s−1). Grey lines indicate the contours of constant mean absolute differences and are spaced by 1 km s−1. As a proxy for the error on the Vogelsberger parameters, a green contour is drawn where the differences are doubled with respect to the minimum difference.
Current usage metrics show cumulative count of Article Views (full-text article views including HTML views, PDF and ePub downloads, according to the available data) and Abstracts Views on Vision4Press platform.
Data correspond to usage on the plateform after 2015. The current usage metrics is available 48-96 hours after online publication and is updated daily on week days.
Initial download of the metrics may take a while.