Fig. 3.
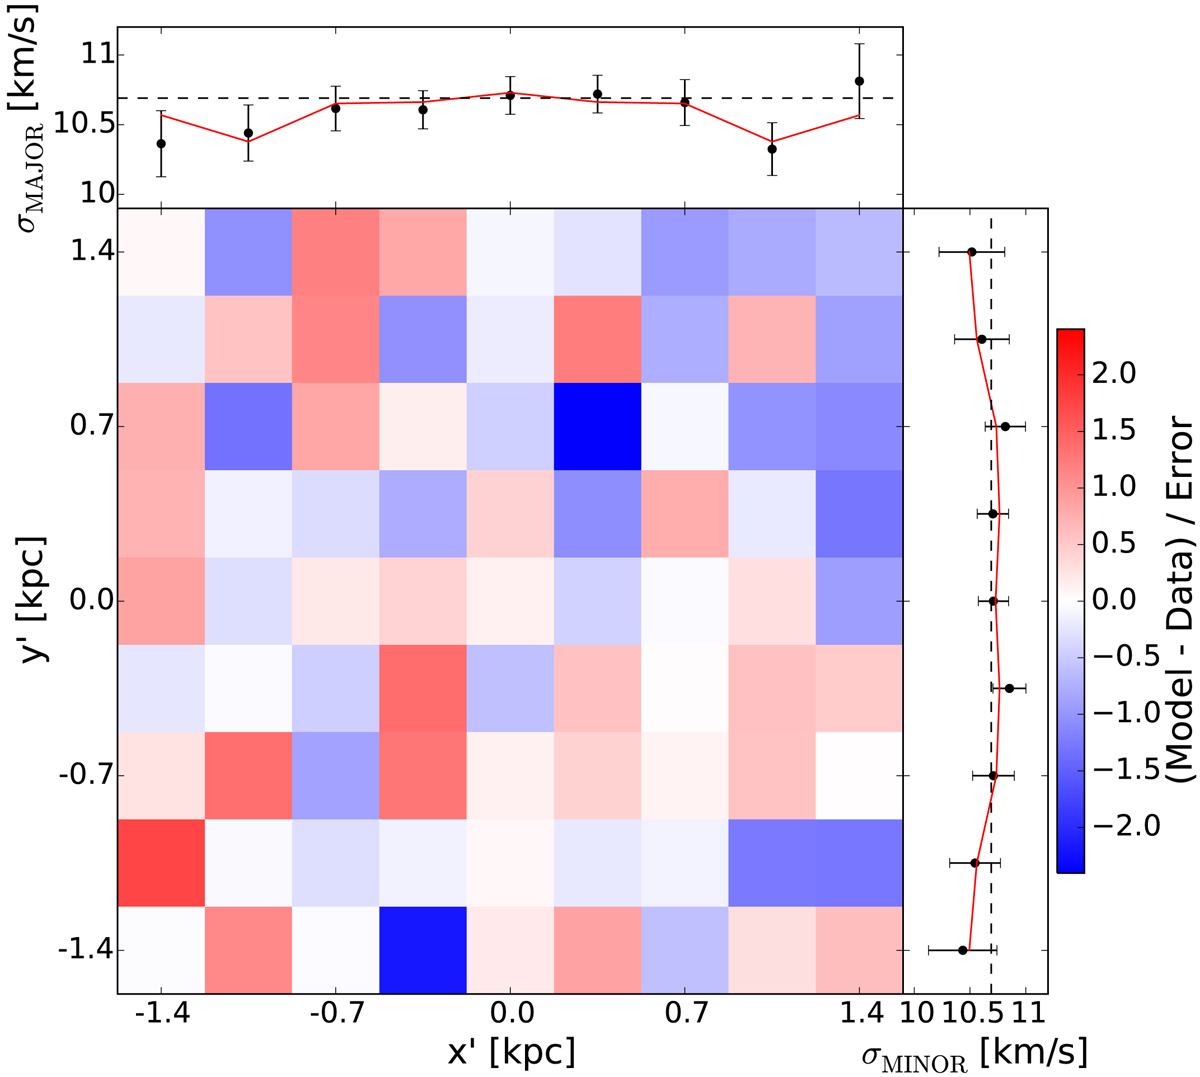
Difference between the best-fit and the observed velocity dispersion in terms of the observed error, for all 9 × 9 kinematic bins. The figure is obtained after fitting the q94v21 library to our mock data consisting of 105 stars with measured line-of-sight velocities in our FOV, assuming an edge-on view. Top and right panels: fit (red full line) obtained along the major and minor axis, respectively. The data points with 68% error bars are shown in black. Black dashed lines indicate the true velocity dispersions from theory (Eq. (4)).
Current usage metrics show cumulative count of Article Views (full-text article views including HTML views, PDF and ePub downloads, according to the available data) and Abstracts Views on Vision4Press platform.
Data correspond to usage on the plateform after 2015. The current usage metrics is available 48-96 hours after online publication and is updated daily on week days.
Initial download of the metrics may take a while.