Fig. 2.
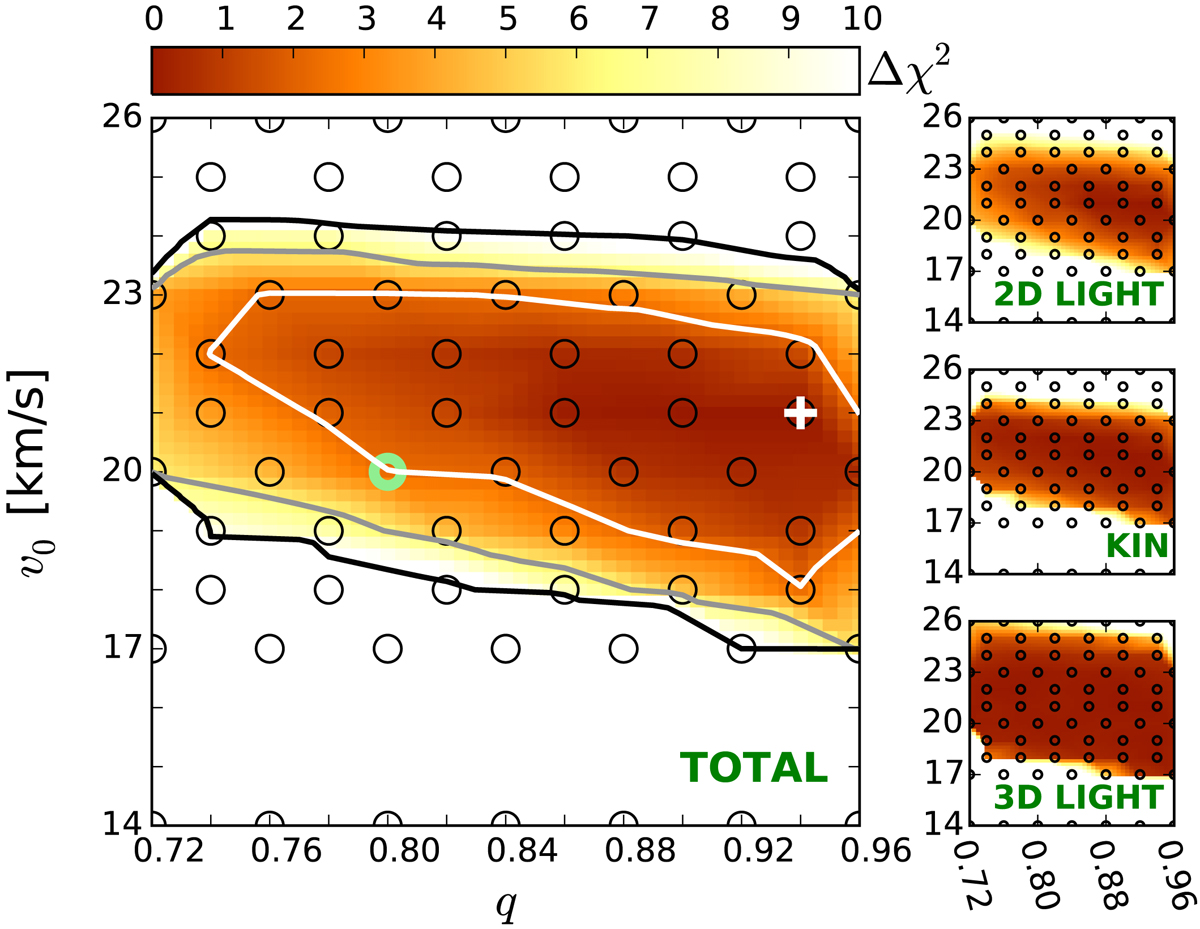
Δχ2-distribution of the characteristic parameters q and v0 of the Evans models obtained after applying the Schwarzschild method. In this case our mock kinematic data consist of 105 stars inside the FOV (3 × 3 kpc). We use 9 × 9 kinematic bins and assume the functional form of the potential of the system and inclination are known. The black circles show the locations where the Schwarzschild models were evaluated. The green circle indicates the input parameters of the mock system. The best-fit model is indicated by the white cross and recovers the mock galaxy mass parameter. In white, grey, and black we show the Δχ2 = [2.3, 6.18, 11.8]-contours, respectively. The coloured landscape on the left shows interpolated Δχ2-values, and goes up to a maximum of Δχ2 = 10. On the right we show the Δχ2-landscapes when decomposing the landscape into ![]() (top),
(top), ![]() (middle), or
(middle), or ![]() (bottom). These right panels sum up to the large panel. We stress that only
(bottom). These right panels sum up to the large panel. We stress that only ![]() is being minimised in the fit.
is being minimised in the fit.
Current usage metrics show cumulative count of Article Views (full-text article views including HTML views, PDF and ePub downloads, according to the available data) and Abstracts Views on Vision4Press platform.
Data correspond to usage on the plateform after 2015. The current usage metrics is available 48-96 hours after online publication and is updated daily on week days.
Initial download of the metrics may take a while.