Fig. C.1.
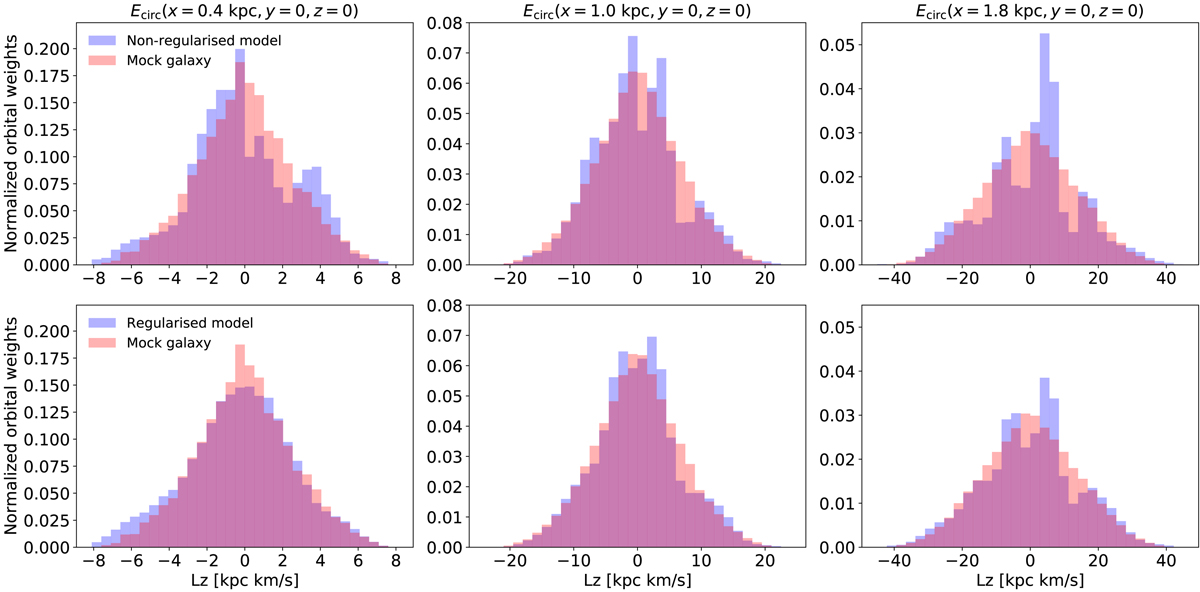
Orbital distributions of angular momentum around the symmetry axis, i.e. Lz, for fixed energy slices corresponding to circular orbits at x = 0.4 (left), x = 1.0 (middle), and x = 1.8 kpc (right). We note the different axes ranges for the panels of each column. In the top row we show the distributions for the true Evans model q80v20 (blue) obtained after fitting a kinematic dataset of 105 stars (see Sect. 4.1) and for a realization of the mock galaxy (red, here containing 4 × 10⁵ stars in total). The effect of adding regularisation to the fit is shown in the bottom panels. Adding regularisation makes the recovered distribution smoother and more similar to the true distribution.
Current usage metrics show cumulative count of Article Views (full-text article views including HTML views, PDF and ePub downloads, according to the available data) and Abstracts Views on Vision4Press platform.
Data correspond to usage on the plateform after 2015. The current usage metrics is available 48-96 hours after online publication and is updated daily on week days.
Initial download of the metrics may take a while.