Fig. 12.
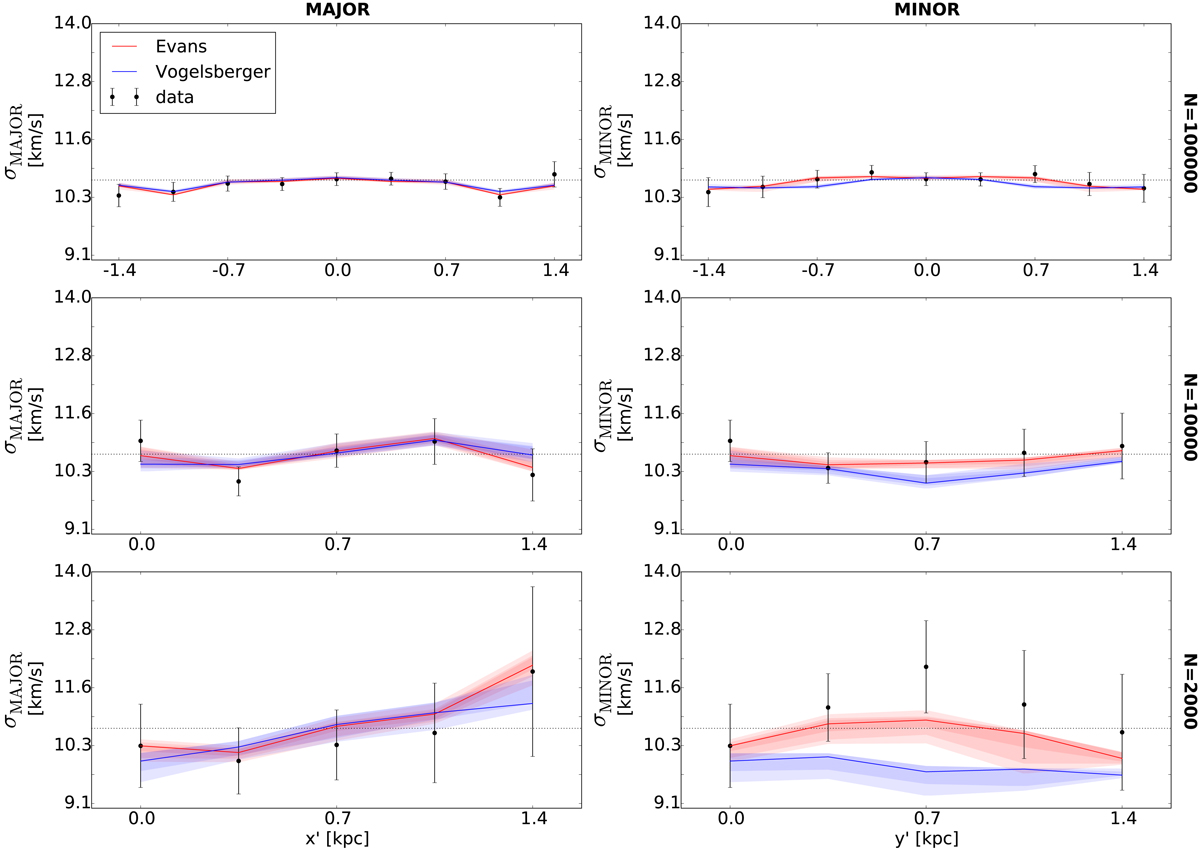
Comparison of the results from the Schwarzschild modelling fits to the observed velocity dispersion along the major (left column) and minor (right column) axis. From top to bottom: best-fit Evans (red line) and Vogelsberger (blue line) models for kinematic datasets containing N = 105, N = 104, and 2000 stars, respectively. The shaded regions denote the error bands computed as described in the text. Black dotted lines indicate the input (theoretical, Eq. (4)) velocity dispersions.
Current usage metrics show cumulative count of Article Views (full-text article views including HTML views, PDF and ePub downloads, according to the available data) and Abstracts Views on Vision4Press platform.
Data correspond to usage on the plateform after 2015. The current usage metrics is available 48-96 hours after online publication and is updated daily on week days.
Initial download of the metrics may take a while.