Fig. 1.
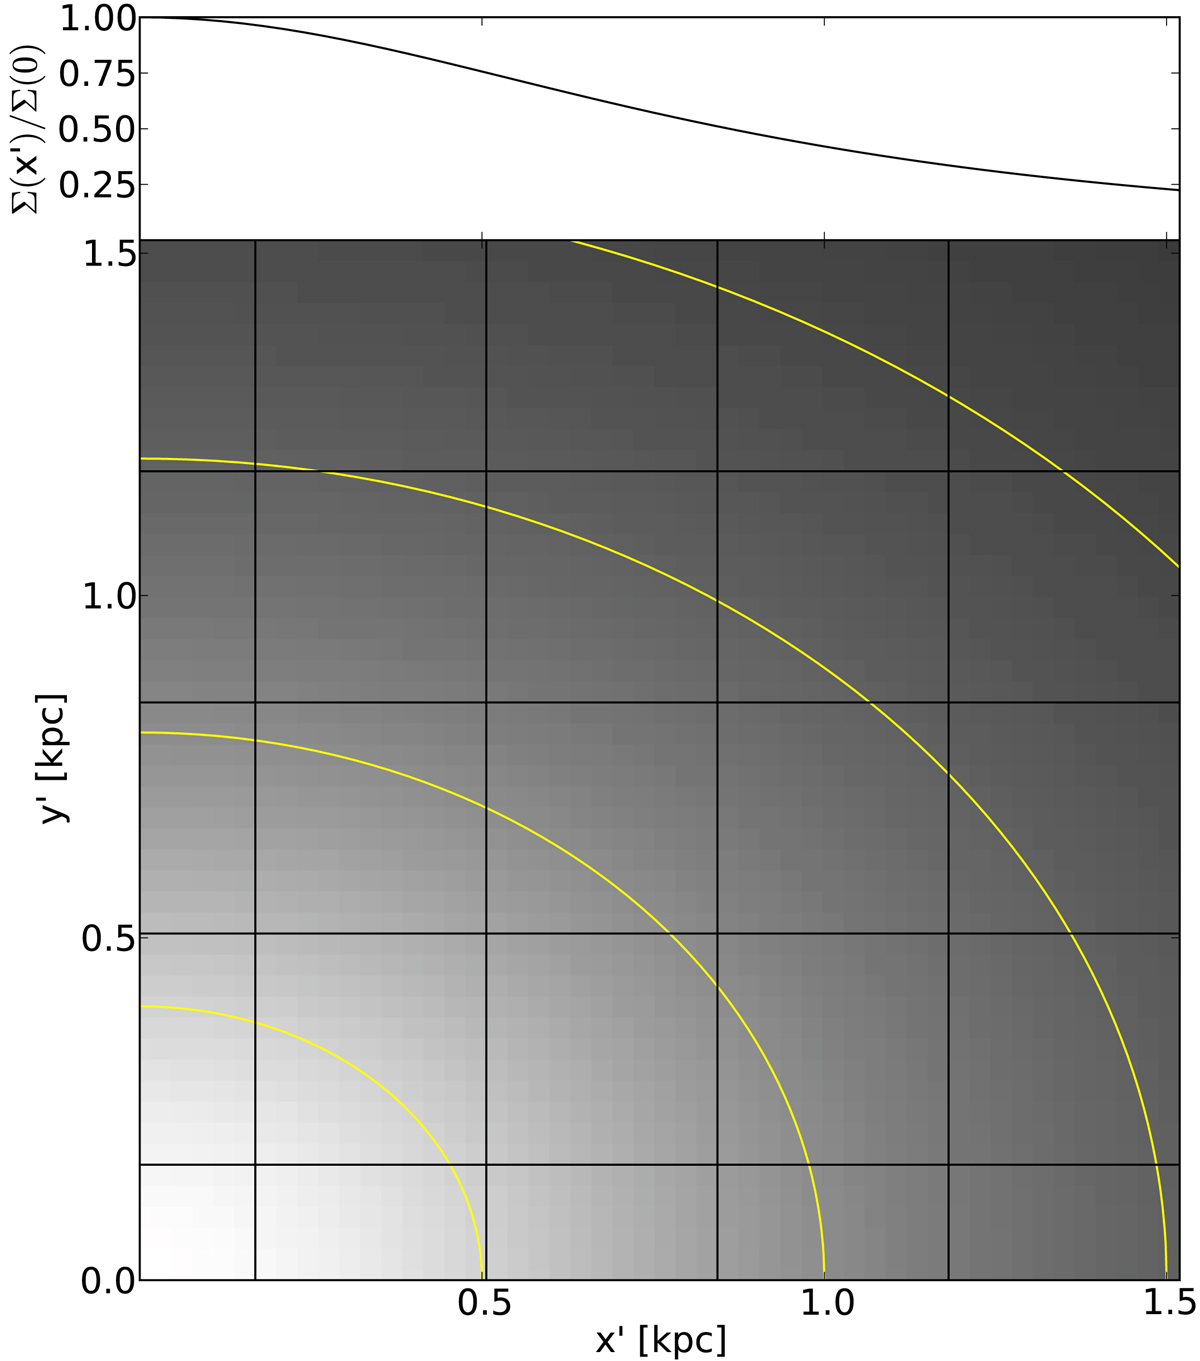
Surface brightness profile of our mock galaxy in an edge-on view. The black horizontal and vertical lines show the boundaries of the kinematic bins. We only show the positive quadrant of our FOV (x′> 0 kpc, y′> 0 kpc). The yellow contours correspond to the isophotes of the system (q* = q = 0.8). In the top panel we have plotted the surface brightness normalised to its central value as function of x′, i.e. along the (projected) major axis of the galaxy.
Current usage metrics show cumulative count of Article Views (full-text article views including HTML views, PDF and ePub downloads, according to the available data) and Abstracts Views on Vision4Press platform.
Data correspond to usage on the plateform after 2015. The current usage metrics is available 48-96 hours after online publication and is updated daily on week days.
Initial download of the metrics may take a while.