Fig. 8
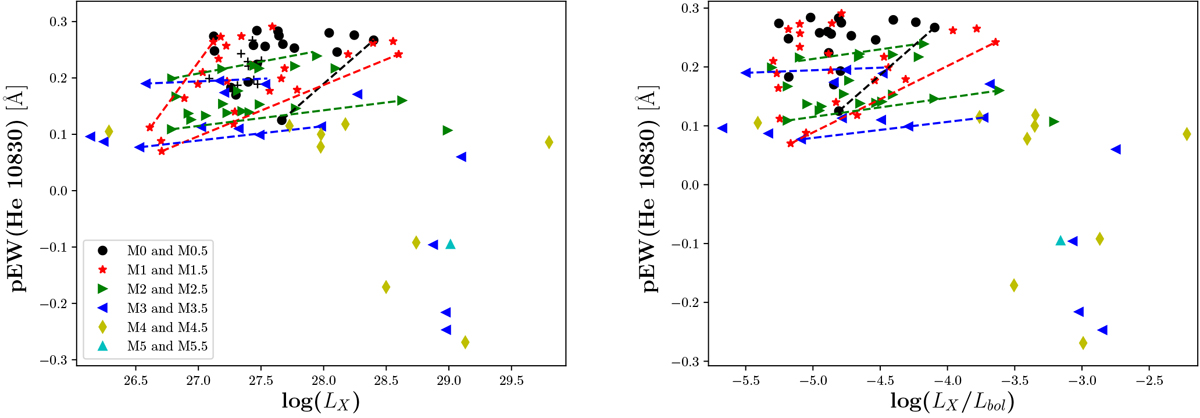
Measurement of pEW of He I IR as function of LX (left panel) and of LX∕Lbol (right panel). Symbols represent the pEW(He IR) of the valid sample with known X-ray fluxes, and colours decode spectral sub-type as in the legend in the left panel. In both panels, dashed lines with colours according to sub-type indicate hypothesise lower and upper envelopes where recognisable, while for the other spectral sub-types only lower envelopes are indicated.
Current usage metrics show cumulative count of Article Views (full-text article views including HTML views, PDF and ePub downloads, according to the available data) and Abstracts Views on Vision4Press platform.
Data correspond to usage on the plateform after 2015. The current usage metrics is available 48-96 hours after online publication and is updated daily on week days.
Initial download of the metrics may take a while.