Fig. 3
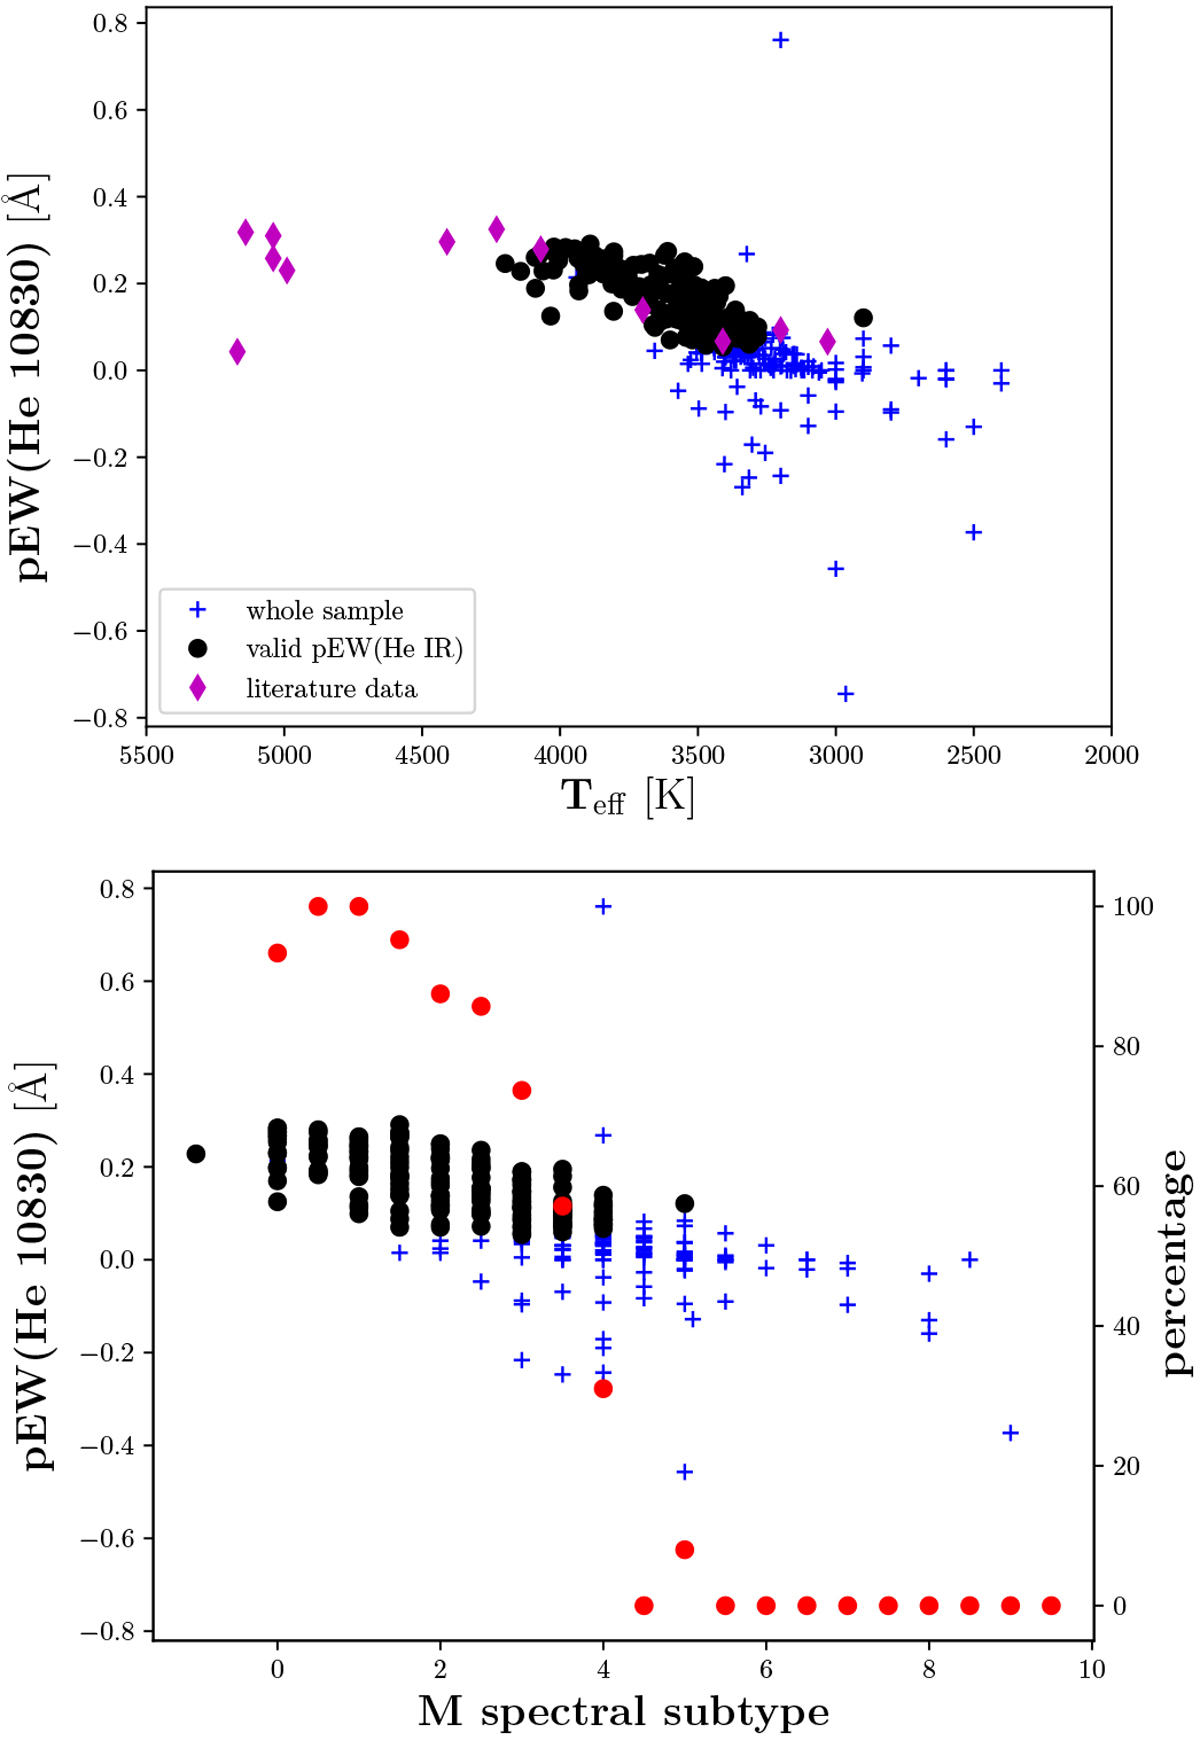
Top: pEW(He IR) as function of effective temperature. Bottom: pEW(He IR) as function of spectral type. Blue crosses represent all sample stars (i. e. the non-valid pEWs), while black dots represent the as valid selected pEWs. In the top panel, magenta diamonds represent literature data from Sanz-Forcada & Dupree (2008), Andretta et al. (2017), and Dupree et al. (2018). In the bottom panel, red dots correspond to the right y-axis and give the percentage of valid measurements for the selection criteria, (see text).
Current usage metrics show cumulative count of Article Views (full-text article views including HTML views, PDF and ePub downloads, according to the available data) and Abstracts Views on Vision4Press platform.
Data correspond to usage on the plateform after 2015. The current usage metrics is available 48-96 hours after online publication and is updated daily on week days.
Initial download of the metrics may take a while.