Free Access
Fig. A.4
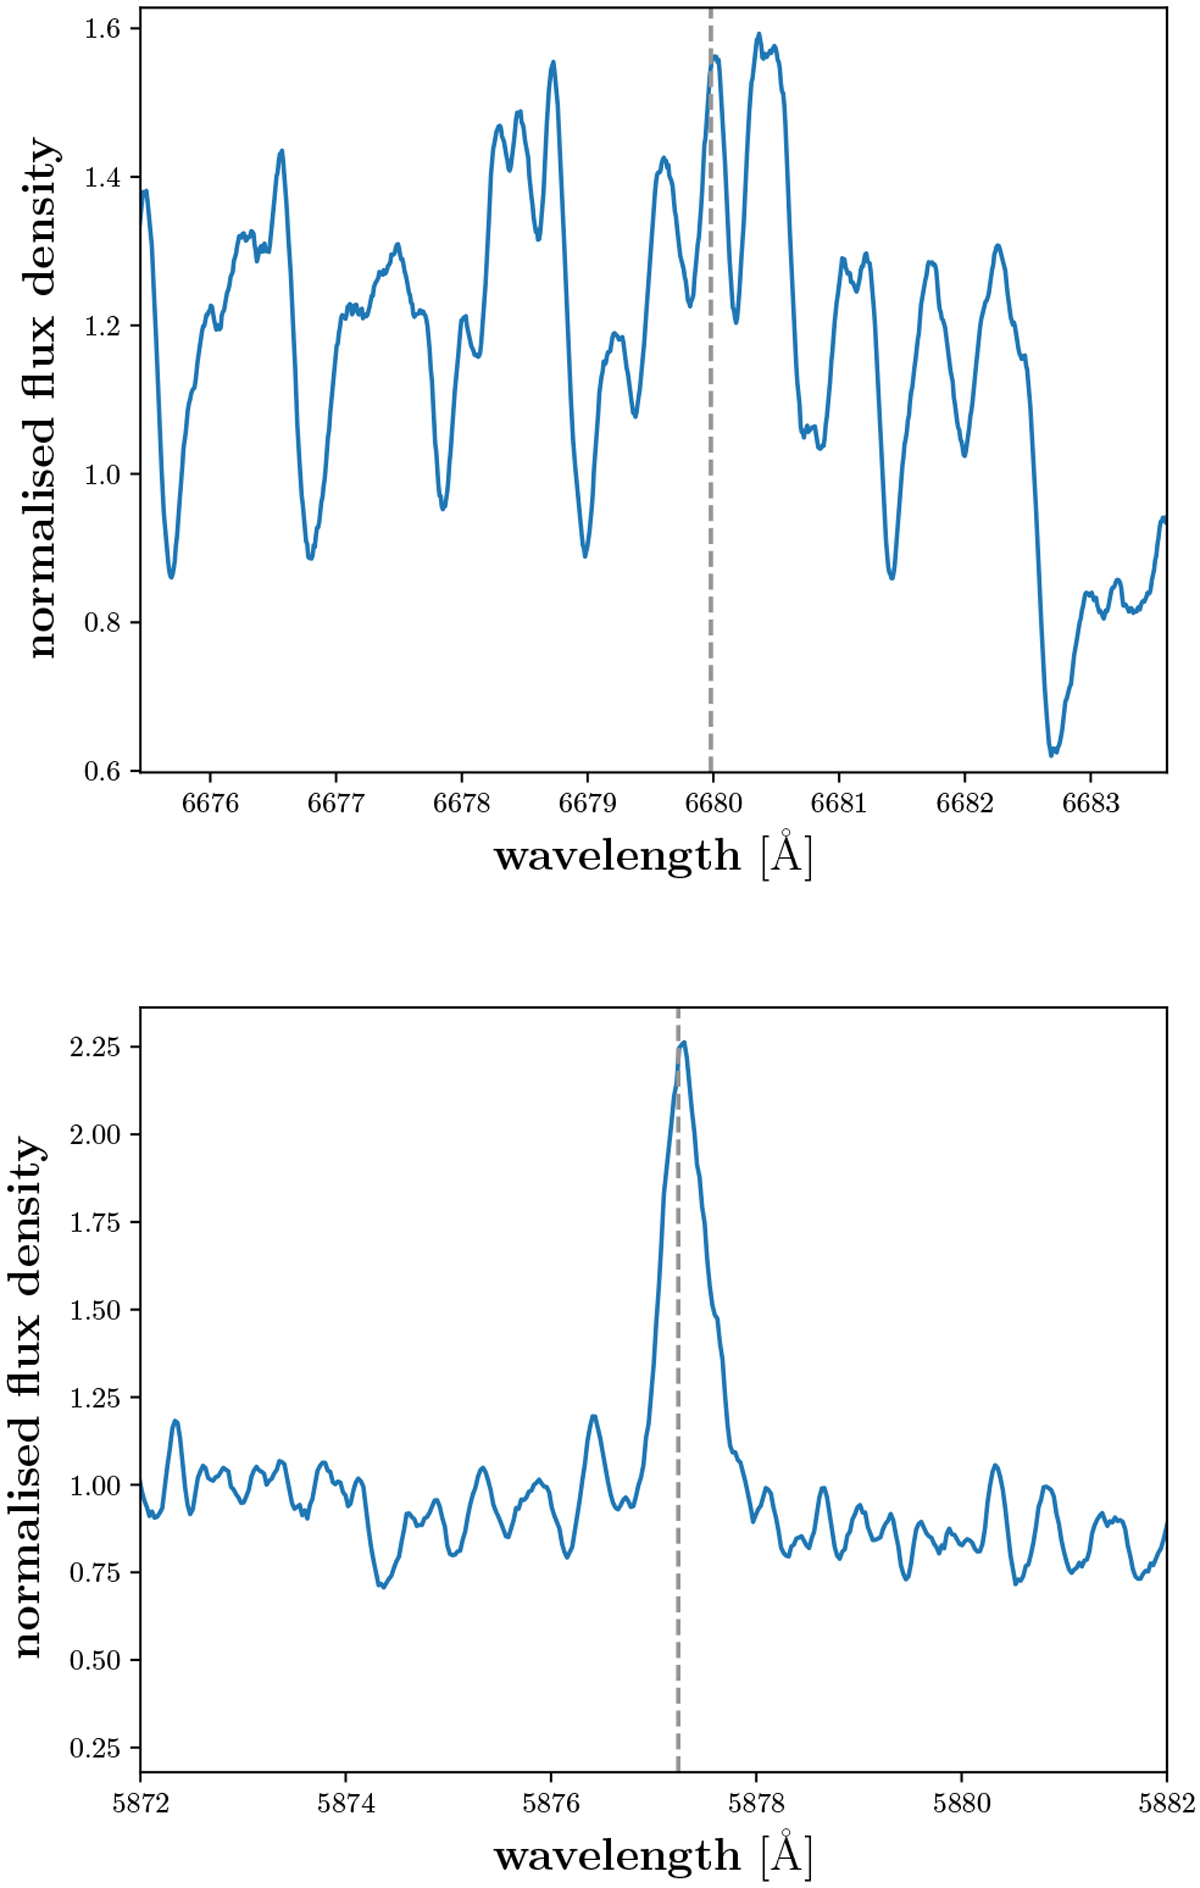
Examples of spectral regions around He I line at 6679 Å (top) and He I D3 line at 5877 Å (bottom) for J07446+035/YZ CMi. Positions of the two lines are marked with grey dashed vertical lines.
Current usage metrics show cumulative count of Article Views (full-text article views including HTML views, PDF and ePub downloads, according to the available data) and Abstracts Views on Vision4Press platform.
Data correspond to usage on the plateform after 2015. The current usage metrics is available 48-96 hours after online publication and is updated daily on week days.
Initial download of the metrics may take a while.