Fig. 1
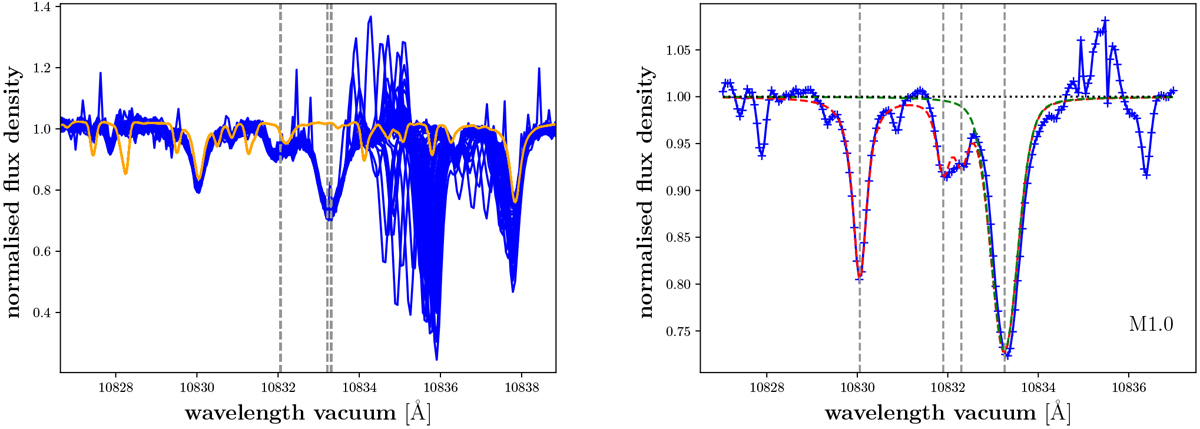
Left: all spectra of J00051+457/GJ 2 used in our analysis in blue. The yellow spectrum is a PHOENIX photospheric model spectrum for comparison. Right: co-added and telluric corrected spectrum of J00051+457/GJ 2 in blue with best fit Voigt model in red. The green dashed line represents the He I line component of the fit. At ~ 10 835 Å, some artefacts of telluric airglow lines can be seen (shown here in the stellar rest frame). In the left panel, we show the positions of the three components of the He I IR line as dashed grey lines. In the right panel, the grey dashed vertical lines mark the positions of lines considered in the fit (see text for details).
Current usage metrics show cumulative count of Article Views (full-text article views including HTML views, PDF and ePub downloads, according to the available data) and Abstracts Views on Vision4Press platform.
Data correspond to usage on the plateform after 2015. The current usage metrics is available 48-96 hours after online publication and is updated daily on week days.
Initial download of the metrics may take a while.