Fig. 6.
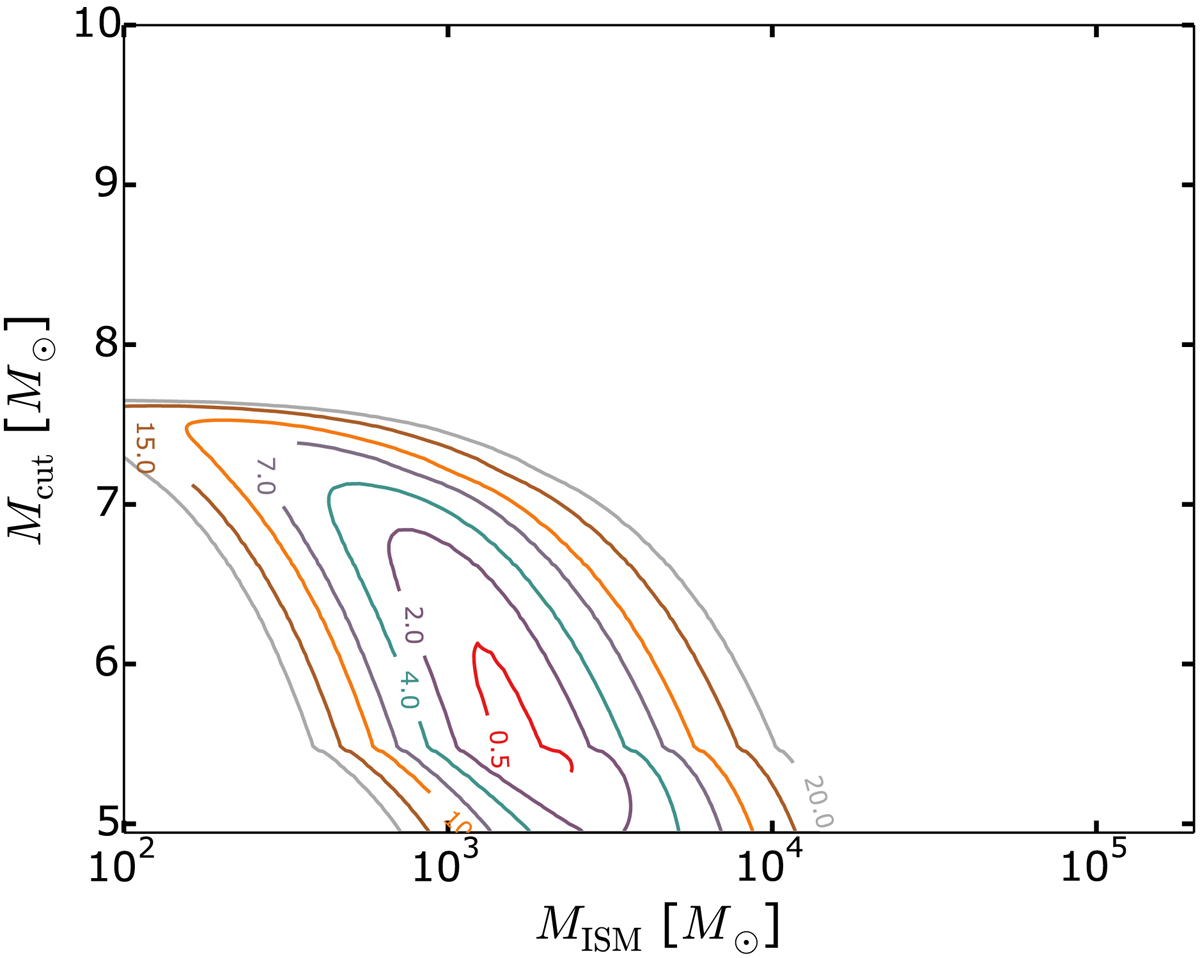
χ2 contour map for the vv7 model, considering the fit of HE 1439−1420 (the axis shows the two free parameters Mcut and MISM). The numbers associated with the contours give the χ2 values. The minimum χ2 is found for Mcut = 5.45 M⊙ and MISM = 1789 M⊙. These values produce the black pattern shown in the top left panel of Fig. 5.
Current usage metrics show cumulative count of Article Views (full-text article views including HTML views, PDF and ePub downloads, according to the available data) and Abstracts Views on Vision4Press platform.
Data correspond to usage on the plateform after 2015. The current usage metrics is available 48-96 hours after online publication and is updated daily on week days.
Initial download of the metrics may take a while.