Fig. 13.
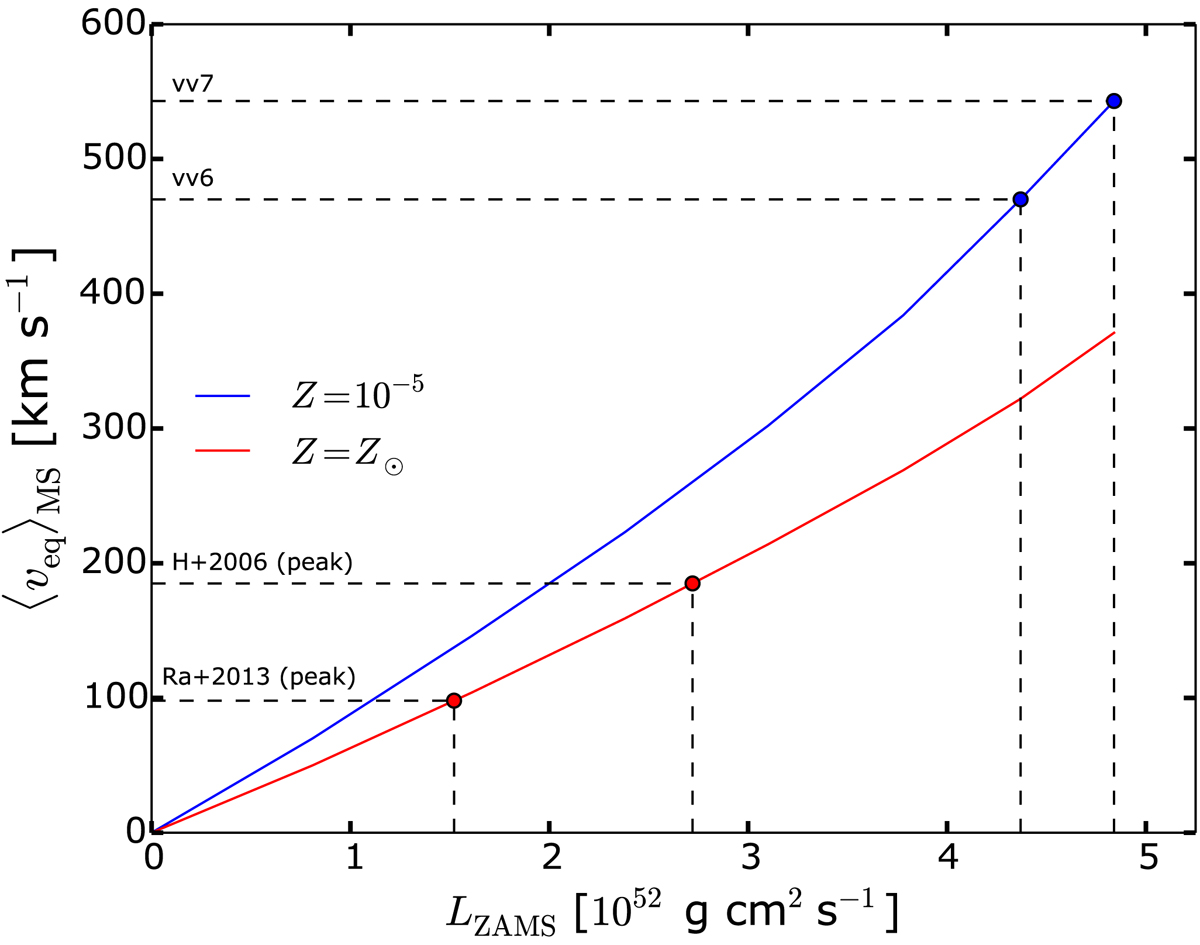
Mean equatorial velocity during the MS as a function of LZAMS, the total angular momentum content at the ZAMS. The two curves show 20 M⊙ models computed at solar metallicity (red) and at Z = 10−5 (blue, the models of Table 2). The two peaks of the Huang & Gies (2006, H+2006) and Ramírez-Agudelo et al. (2013, Ra+2013) velocity distributions are indicated, together with the vv6 and vv7 models.
Current usage metrics show cumulative count of Article Views (full-text article views including HTML views, PDF and ePub downloads, according to the available data) and Abstracts Views on Vision4Press platform.
Data correspond to usage on the plateform after 2015. The current usage metrics is available 48-96 hours after online publication and is updated daily on week days.
Initial download of the metrics may take a while.